
Figure 1
- ID
- ZDB-IMAGE-210902-124
- Antibodies
- Publication
- Oliveira et al., 2021 - Zebrafish Model as a Screen to Prevent Cyst Inflation in Autosomal Dominant Polycystic Kidney Disease
- All Figures
- Figures for Oliveira et al., 2021
|
Figure 1
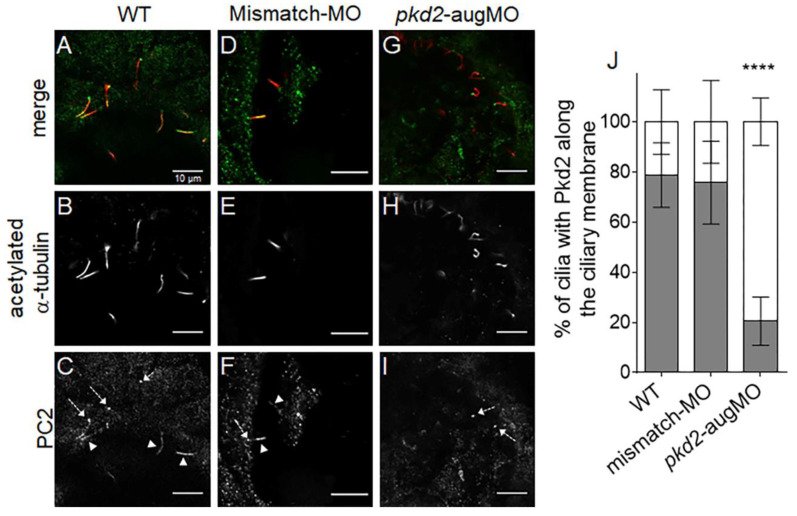
PC2 staining along the KV cilia from 10 ss embryos. (A–I) Confocal images showing immunolocalization of PC2 in KV cells at the 10–11 ss in WT (A–C), mismatch-MO (D–F), and PC2-knockown (pkd2-augMO) (G–I) embryos. White arrowheads indicate PC2 detected along cilia and dashed arrows indicate PC2 at the cilia basal body. (J) Quantification of the percentage of cilia having PC2 signal along their membrane (gray bars) versus those with no PC2 staining along their membrane (white bars) in WT (n = 16), mismatch-MO (n = 8), and PC2-knockown (n = 8) embryos, immunodetected for acetylated α-tubulin. All samples followed a normal distribution and presented equal variances. Differences were, thus, statistically tested by t-test, **** p < 0.0001. Scale bars: 10 μm.