
Fig. 7
- ID
- ZDB-IMAGE-210817-9
- Publication
- Sehgal et al., 2021 - LncRNA VEAL2 regulates PRKCB2 to modulate endothelial permeability in diabetic retinopathy
- All Figures
- Figures for Sehgal et al., 2021
|
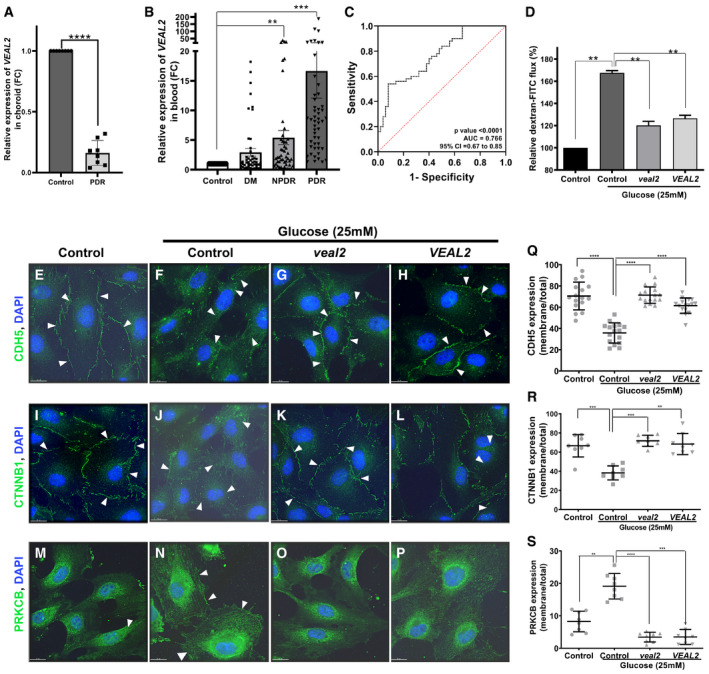
Fig. 7
Bar graph representing relative expression of Bar graph representing relative fold change of ROC curve shows sensitivity and specificity of Complementation of Modeling hyperglycemia in HUVEC resulted in dysregulation of junctional assembly of CDH5 and CTNNB1 proteins and increased membrane localization of PRKCB protein. Complementation of
Data information: All the experiments