
|
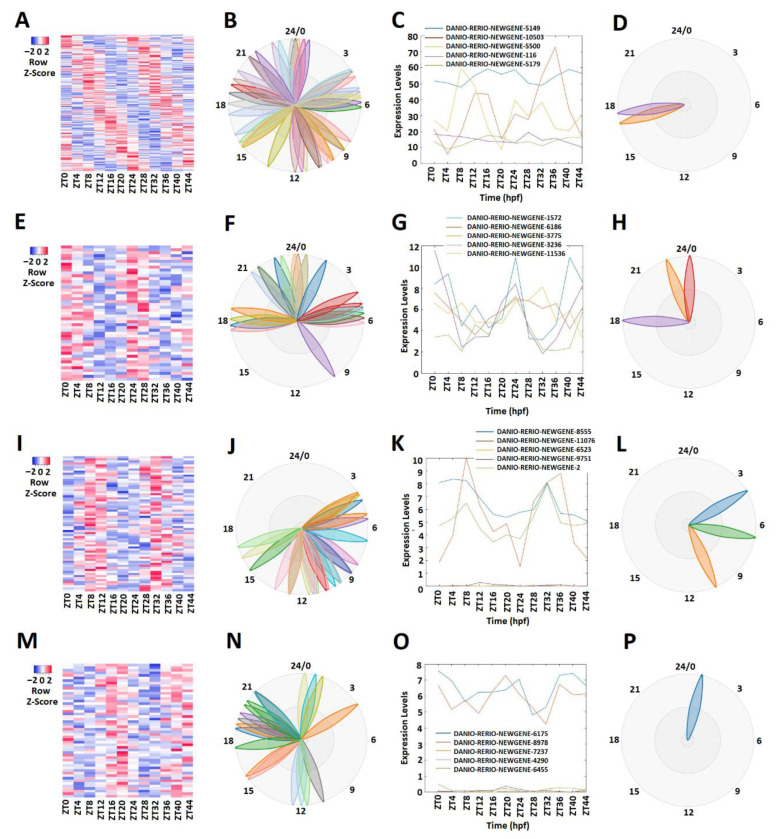
Figure 3 Expression profile analysis of morning (ZT 0 and ZT4), evening (ZT8 and ZT12), and night (ZT 16 and ZT 20) rhythmically expressed testis lncRNAs. Analysis of all 165 rhythmically expressed testis lncRNAs (A–D): heat map (A) and phases (B) of all 165 rhythmically expressed testis lncRNAs; expression profiles (C) and phases (D) of representative lncRNAs. Analysis of 47 testis morning lncRNAs (E–H): heat map (E) and phases (F) of 47 testis morning lncRNAs; expression profiles (G) and phases (H) of representative testis morning lncRNAs. Analysis of 66 testis evening lncRNAs (I–L): heat map (I) and phases (J) of 66 testis evening lncRNAs; expression profiles (K) and phases (L) of representative testis evening lncRNAs. Analysis of 52 testis lncRNAs (M–P): heat map (M) and phases (N) of 52 testis night lncRNAs; expression profiles (O) and phases (P) of representative testis night lncRNAs.