
|
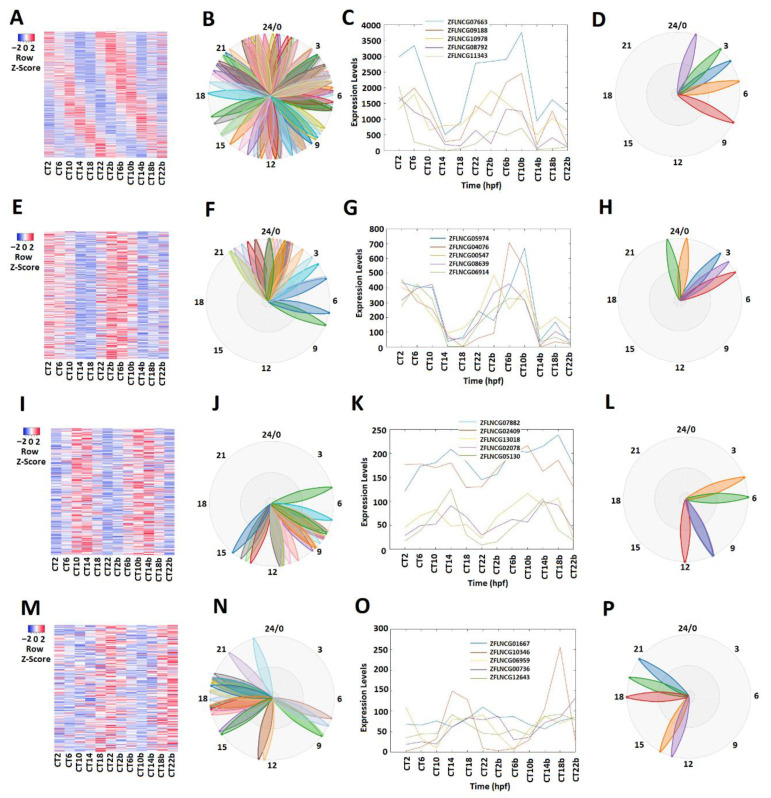
Figure 1 Expression profile analysis of morning (CT 2 and CT 6), evening (CT10 and CT14), and night (CT18 and CT22) rhythmically expressed pineal gland lncRNAs. Analysis of all 586 rhythmically expressed pineal gland lncRNAs (A–D): heat map (A) and phases (B) of all 586 rhythmically expressed pineal gland lncRNAs; expression profiles (C) and phases (D) of representative lncRNAs. Analysis of 241 pineal gland morning lncRNAs (E–H): heat map (E) and phases (F) of 241 pineal gland morning lncRNAs; expression profiles (G) and phases (H) of representative pineal gland morning lncRNAs. Analysis of 196 pineal gland evening lncRNAs (I–L): heat map (I) and phases (J) of 189 pineal gland evening lncRNAs; expression profiles (K) and phases (L) of representative pineal gland evening lncRNAs. Analysis of 149 pineal gland night lncRNAs (M–P): heat map (M) and phases (N) of 217 pineal gland night lncRNAs; expression profiles (O) and phases (P) of representative pineal gland night lncRNAs.