IMAGE

FIGURE 2

ID
ZDB-IMAGE-210807-4
Source
Figures for Li et al., 2021
Image
Figure Caption

FIGURE 2

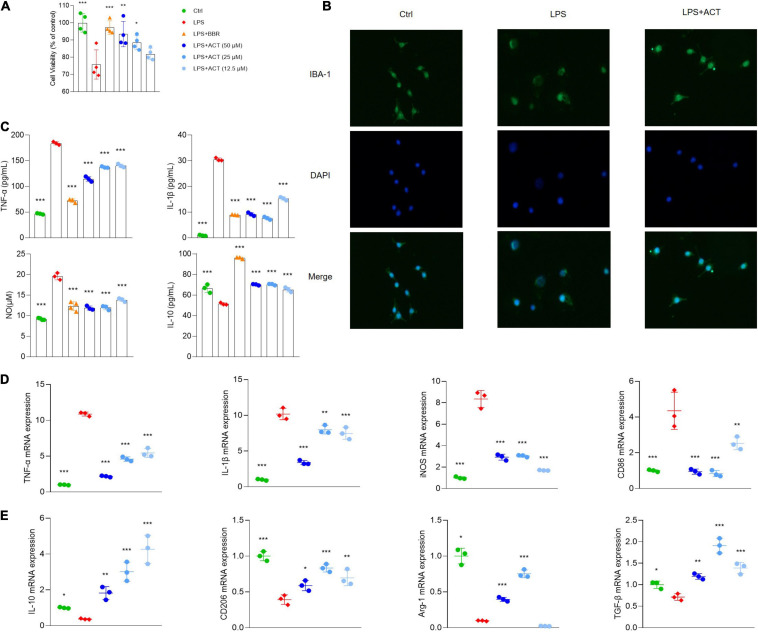
ACT regulated M1/M2 polarization in LPS-stimulated BV-2 cells. (A) Effects of ACT on LPS-induced BV-2 cell viability. (B) Cell morphology with IBA-1 staining was observed with inverted phase contrast fluorescence microscope (×10). The control group exhibited small soma with distal arborization, showing the typical ramified morphology of resting microglia. The LPS group became fewer and shorter branches with a greatly enlarged cell body, the characteristic shapes of activated microglia. The ACT groups showed attenuated LPS-induced morphological changes. (C) Effects of ACT on LPS-induced elevation of cell supernatant TNF-α, IL-1β, and IL-10 levels as well as NO elevation. *P < 0.05, ***P < 0.005, versus the LPS group. n = 3. Berberine (BBR) as a positive control. (D) Effects of ACT on M1 microglia polarization related markers. (E) Effect of ACT on M2 microglia polarization related markers. *P < 0.05, **P < 0.01, ***P < 0.005, versus the LPS group. n = 3.

Acknowledgments
This image is the copyrighted work of the attributed author or publisher, and ZFIN has permission only to display this image to its users. Additional permissions should be obtained from the applicable author or publisher of the image. Full text @ Front Cell Dev Biol