
IMAGE
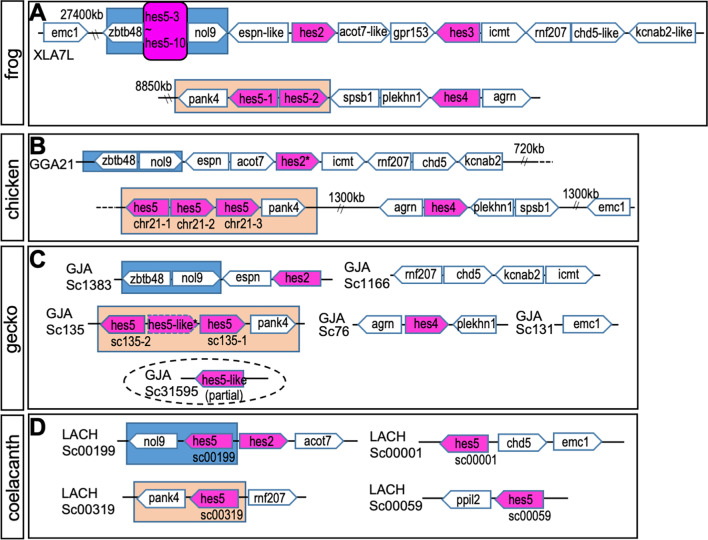
Fig. 2
- ID
- ZDB-IMAGE-210803-2
- Publication
- Kuretani et al., 2021 - Evolution of hes gene family in vertebrates: the hes5 cluster genes have specifically increased in frogs
- All Figures
- Figures for Kuretani et al., 2021
Image
|
Figure Caption
Fig. 2
Syntenic analysis of
Acknowledgments
This image is the copyrighted work of the attributed author or publisher, and
ZFIN has permission only to display this image to its users.
Additional permissions should be obtained from the applicable author or publisher of the image.
Full text @ BMC Ecol Evol