
|
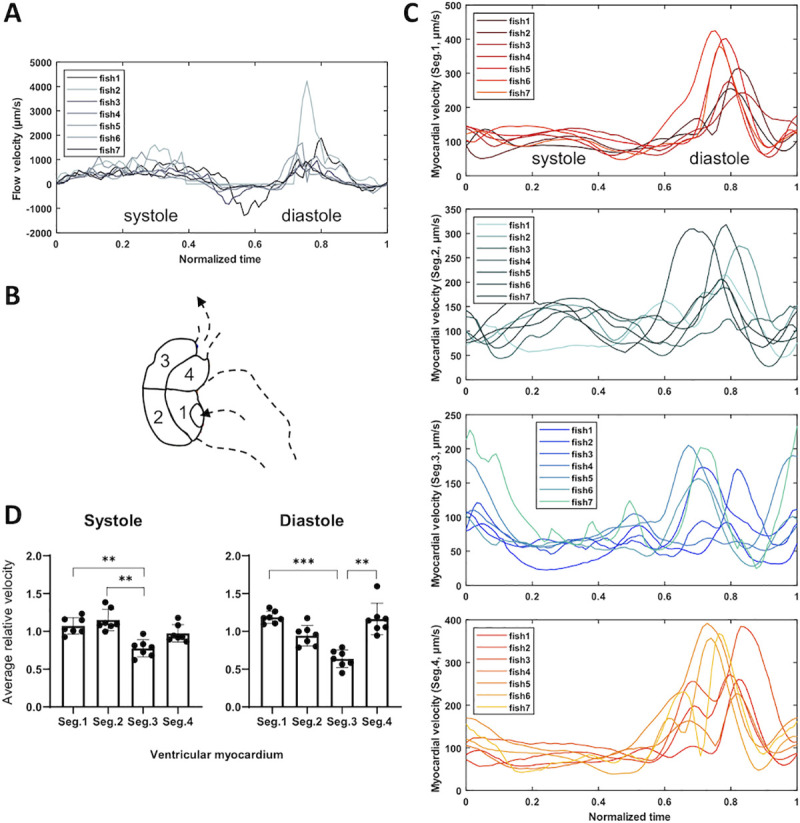
Fig 4
(A) Blood flow velocity is depicted during a cardiac cycle. To compare among different heart rates, we normalize the time to one cardiac cycle for each zebrafish embryo. (B) The ventricle is divided into 4 segments. Arrows indicate the flow direction. The dotted line delineates the atrium. (C) The tracing of the myocardial velocity is normalized to one cardiac cycle in each segment. (D) The mean of relative displacement velocity is depicted in each segment during systole and diastole. The relative velocity in each segment is compared as the ratio of the segmental velocity to the mean of global velocity during a cardiac cycle. Kruskal-Wallis test and Dunn’s multiple comparisons test are performed in GraphPad Prism (**