IMAGE

Fig 2

ID
ZDB-IMAGE-210801-56
Source
Figures for Wang et al., 2021
Image
Figure Caption

Fig 2 Post-imaging computation to reconstruct 3-D vector fields for myocardial displacement and blood flow.

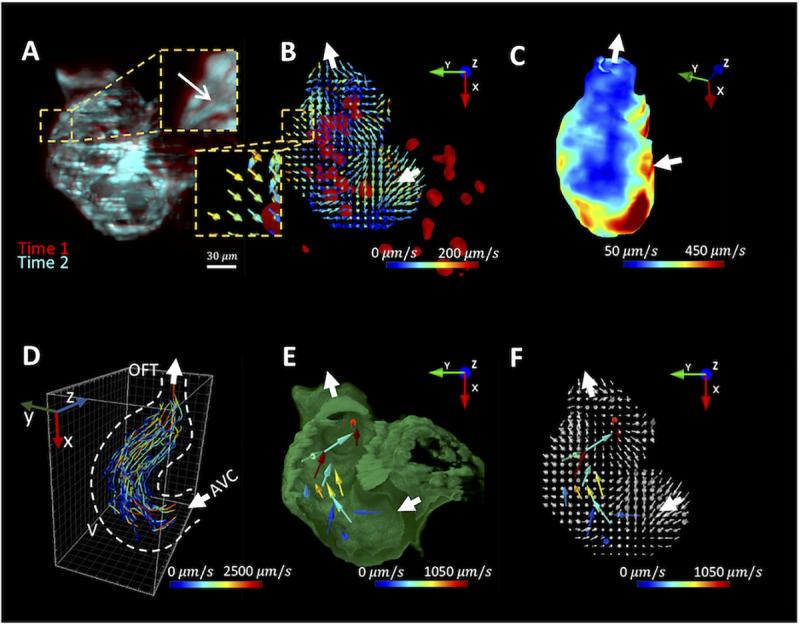
(A) Images of the myocardium from 2 different time points are overlaid to demonstrate the myocardial displacement. The arrow indicates the direction of displacement. (B) Deformable image registration (DIR) is used to infer the myocardial displacement between frames. Each vector indicates the direction and magnitude of the displacement velocity as color-coded by the magnitude (μm/s) in the corresponding voxel. Intracardiac blood cells (red) and flow direction (white arrow) are superimposed with the vector field. (C) A representative heatmap depicts the segmental variations in the magnitude of the myocardial velocity. (D) Particle tracking velocity follows the trajectories of the blood cells during the cardiac cycles. V: ventricle; OFT: outflow tract; AVC: atrioventricular canal. (E) The vector field represents the direction and speed of the blood cells. Dissected myocardium (green) and flow direction (white arrow) are superimposed with the vector field. (F) The velocity vector fields for myocardial displacement and the traveling blood cells are merged.

Acknowledgments
This image is the copyrighted work of the attributed author or publisher, and ZFIN has permission only to display this image to its users. Additional permissions should be obtained from the applicable author or publisher of the image. Full text @ PLoS Comput. Biol.