A Pipeline for high speed imaging for ventricular contraction and intracardiac flow dynamics.
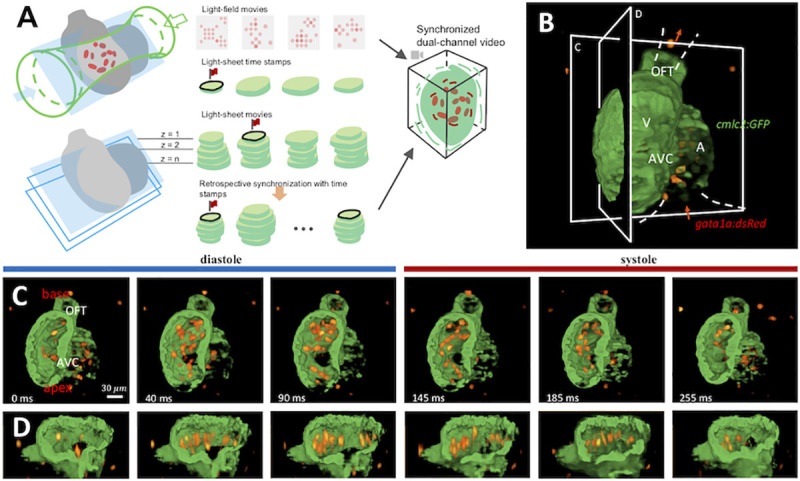
(A) The integration of light-sheet and light-field microscopy captures the contracting myocardium (cmlc2:GFP) and traveling blood cells (gata1a:dsRed) at 200 volumes per second. The light field-generated blood cell images (upper illustration) are synchronized with the light sheet-generated myocardial cross-section images (lower illustration). (B) GFP-labeled cardiomyocyte light chain (cmlc2) and dsRed-labeled blood cells (gata1a) are simultaneously visualized in a 3-D reconstructed embryonic heart. The red arrows indicate the direction of blood flow. A: atrium; V: ventricle. (C & D) A time sequence of a cardiac cycle is illustrated in the coronal (C) and sagittal (D) plane, respectively. During diastole (light-blue bar), the blood cells traverse the atrioventricular canal (AVC) into ventricle. During systole, the blood cells travel through the outflow tract (OFT).
Acknowledgments
This image is the copyrighted work of the attributed author or publisher, and
ZFIN has permission only to display this image to its users.
Additional permissions should be obtained from the applicable author or publisher of the image.
Full text @ PLoS Comput. Biol.
Your Input Welcome
Thank you for submitting comments. Your input has been emailed to ZFIN curators who may contact you if
additional information is required.
Oops. Something went wrong. Please try again later.