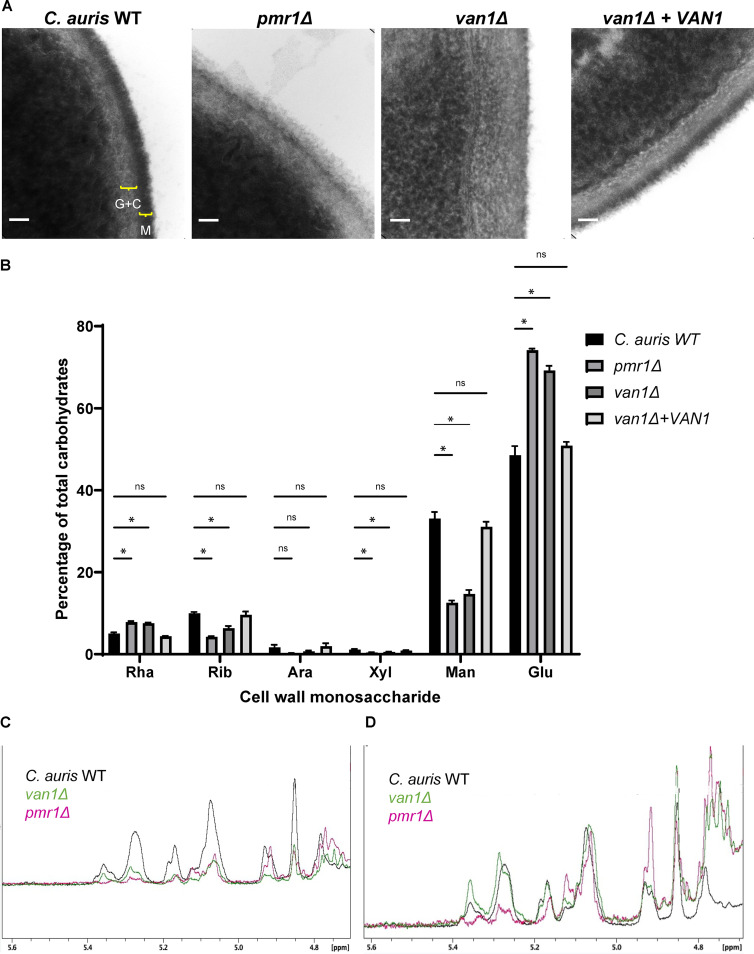
IMAGE

FIG 3

ID
ZDB-IMAGE-210726-11
Source
Figures for Horton et al., 2021
Image
Figure Caption

FIG 3

C. aurispmr1Δ and van1Δ strains display an altered cell wall structure that contains less mannan. (A) C. auris yeast were imaged via transmission electron microscopy at 383,000× magnification, and scale bars represent 50 nm. Brackets denote distinct cell wall layers: G+C, β-glucan and chitin; M, mannan. (B) The monosaccharide compositions of cell walls were measured by gas chromatography, n = 5, mean with SEM shown, *, P < 0.05; ns, not significant by one-way ANOVA with Holm-Sidak multiple comparisons to C. auris WT. Rha, rhamnose; Rib, ribose; Ara, arabinose; Xyl, xylose; Man, mannose; Glu, glucose. (C and D) The structures of isolated mannans were analyzed by 1H NMR and COSY spectra. C shows the 1H NMR spectra for each strain following mannan isolation. In panel D, the intensities were adjusted to the resonance assigned to sidechain-linked backbone α1-6-linked mannosyl repeat units (5.07 ppm) to compare mannan structures.

Acknowledgments
This image is the copyrighted work of the attributed author or publisher, and ZFIN has permission only to display this image to its users. Additional permissions should be obtained from the applicable author or publisher of the image. Full text @ mSphere