
|
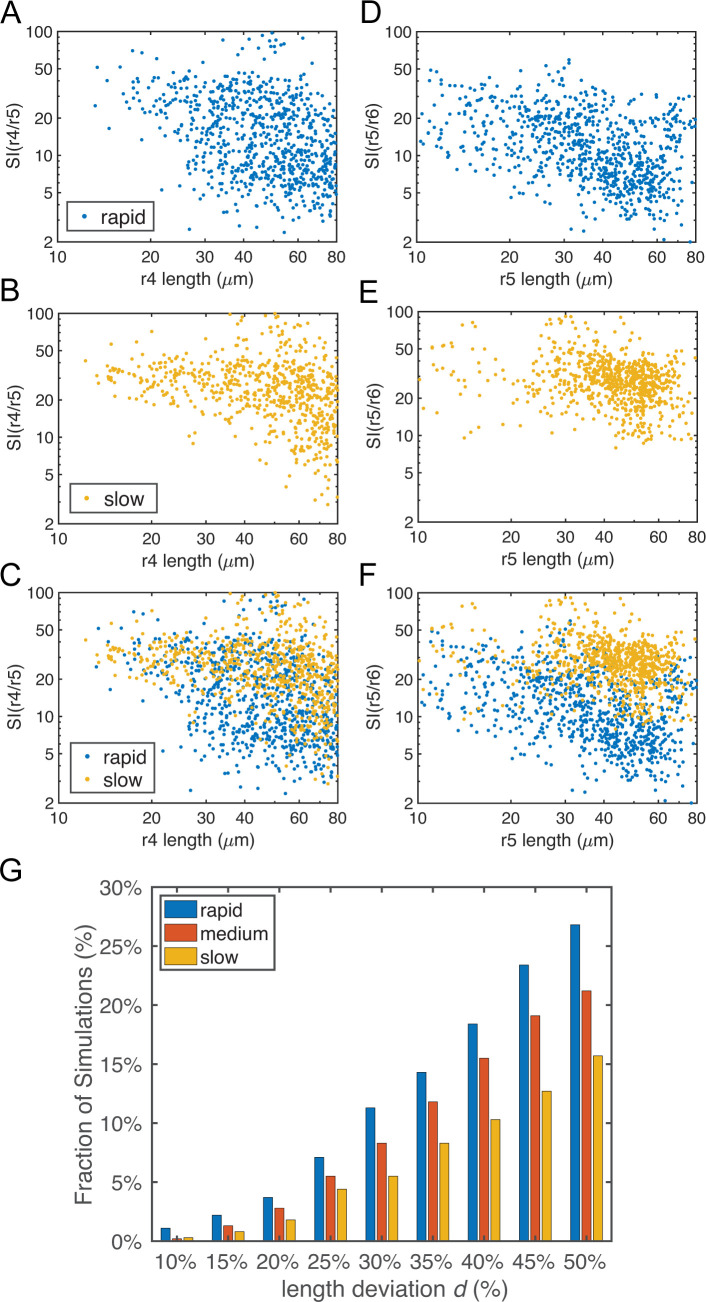
Fig 7
Parameters for gene regulation were randomly perturbed and a total of n = 1000 simulations are displayed for each convergence rate. There are 513, 563 and 452 simulations for rapid, medium and slow initial convergence, respectively, which successfully generate the r2-6 pattern with four boundaries. (A-F) Dot plots showing the relationship between rhombomere length and boundary sharpness. Each point represents the corresponding quantities for each simulation. (A-C) Length of r4 versus sharpness index (SI) of the r4/r5 boundary with: (A) rapid initial convergence, (B) slow initial convergence and (C) a comparison between rapid and slow initial convergence. (D-F) Length of r5 versus SI of r5/r6 boundary with: (D) rapid initial convergence, (E) slow initial convergence and (F) a comparison between rapid and slow initial convergence. (G) Fractions of simulations achieving roughly equal rhombomere lengths versus the deviation