
Figure 2.
- ID
- ZDB-IMAGE-210708-73
- Genes
- Publication
- Pollock et al., 2021 - Transcriptomic analysis of zebrafish prion protein mutants supports conserved cross-species function of the cellular prion protein
- All Figures
- Figures for Pollock et al., 2021
|
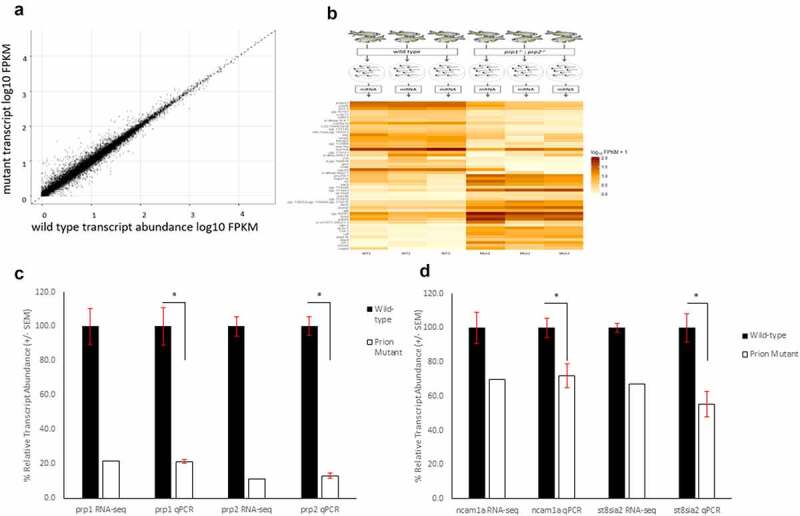
Figure 2.
RNA-Sequencing show 1249 genes with an increase or decrease of log2 fold change of 0.5 between wild-type and compound homozygous prion mutant zebrafish larvae. (A) Scatter graph showing relative FPKM values for wild-type (X-axis) and mutant (Y-axis) genes after RNA-sequencing. (B) Methodology diagram showing RNA-sequencing workflow. Two groups, wild-type and prion mutant (