
|
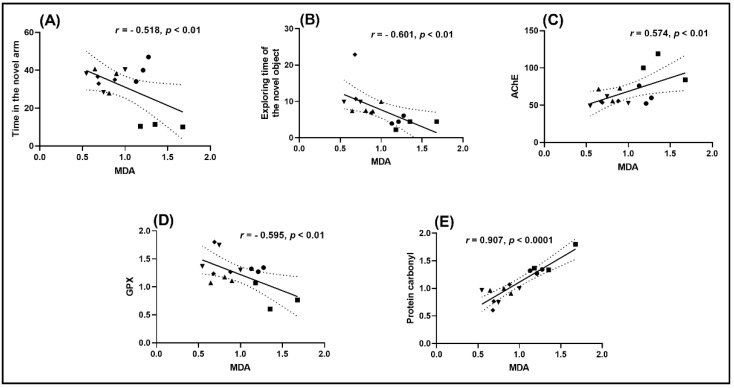
Figure 5 Correlation analyses between behavioral and biochemical parameters (Pearson’s correlation). Data expressed are time in the novel arm (s), exploring the time of the novel object (s), AChE (nmol/min/mg protein), GPX (U/mg protein), protein carbonyl (nmol/mg protein), and MDA (nmol/mg protein). (A) Time in the novel arm vs. MDA (n = 10, r = −0.518, p < 0.01); (B) Exploring time of the novel object vs. MDA (n = 10, r = −0.601, p < 0.01); (C) AChE vs. MDA (n = 10, r = 0.574, p < 0.01); (D) GPX vs. MDA (n = 10, r = −0.595, p < 0.01) and (E) protein carbonyl vs. MDA (n = 10, r = 0.907, p < 0.0001) in control (●), scopolamine (Sco) (■), and baicalein 5,6-dimethyl ether ((▲) 1, (▼) 3, and (♦) 5 μg/L) groups.