
Fig. 4
- ID
- ZDB-IMAGE-210617-95
- Genes
- Publication
- Peloggia et al., 2021 - Adaptive cell invasion maintains lateral line organ homeostasis in response to environmental changes
- All Figures
- Figures for Peloggia et al., 2021
|
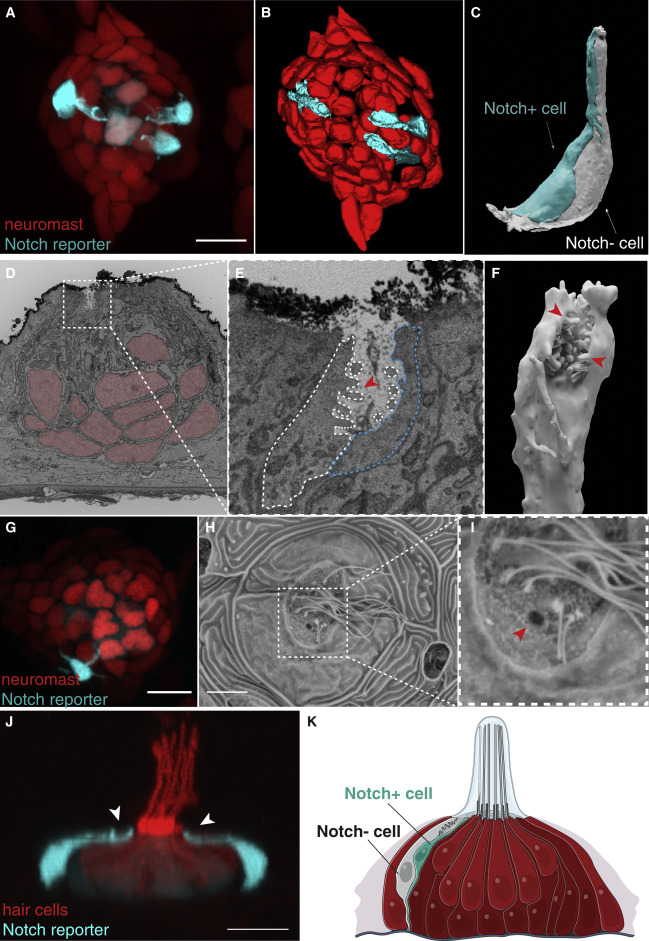
Fig. 4 (A) Maximum intensity projection of a neuromast labeled by she:H2A-mCherry;tp1bglobin:EGFP shows nuclei of the neuromast cells in red and three Notch+ Nm ionocytes in cyan. (B) 3D modeling of the SBF-SEM stack of the same neuromast in (A). (C) 3D modeling of the Nm ionocyte pair (white and cyan). (D) Single image of a transverse section of the SBF-SEM shows the apical part of a pair of Nm ionocytes (white square) and neuromast cells (red nuclei). (E) Magnification of white square in (D) showing microvilli (red arrowhead) and the apical crypt of the ionocyte pair exposed to the outside of the neuromast. (F) 3D modeling of the microvilli (red arrowheads) containing crypt of the Notch− cell. (G) A neuromast labeled by she:H2A-mCherry;tp1bglobin:EGFP. (H) Scanning electron micrograph of the same neuromast in (G). (I) Magnification of the region in white square in (H). Red arrowhead depicts an opening in the neuromast cuticular plate that correlates with the position of the Nm ionocyte pair. (J) Lateral view of a 3D projection of a tp1bglobin:EGFP;Myo6b:Lck-mScarlet-I neuromast (Video S11). Nm ionocytes have long apical projections with the apical crypt (white arrowheads) close to the cuticular plate. (K) Model of the neuromast (red) containing a pair of Nm ionocytes (white and cyan). (A) and (G) are non-linear adjusted (gamma). See also Figure S4 and Videos S10 and S11.
Reprinted from Developmental Cell, 56(9), Peloggia, J., Münch, D., Meneses-Giles, P., Romero-Carvajal, A., Lush, M.E., Lawson, N.D., McClain, M., Pan, Y.A., Piotrowski, T., Adaptive cell invasion maintains lateral line organ homeostasis in response to environmental changes, 1296-1312.e7, Copyright (2021) with permission from Elsevier. Full text @ Dev. Cell