IMAGE

Fig. 2

ID
ZDB-IMAGE-210612-13
Source
Figures for Holler et al., 2021
Image
Figure Caption

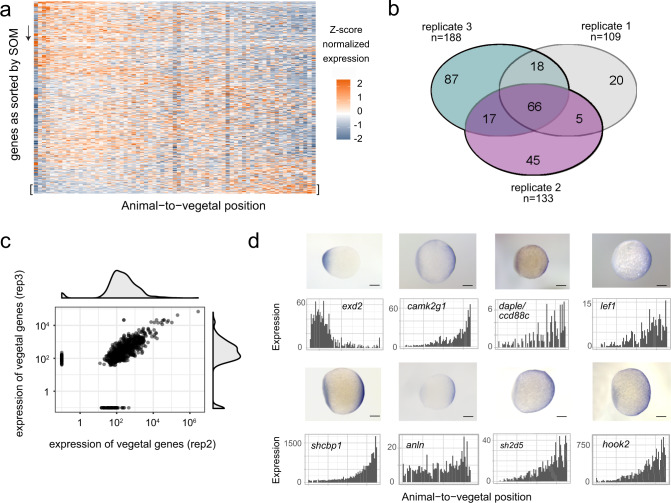
Fig. 2 Systematic identification of mRNA localization patterns.

a Heatmap representation of z-score normalized expression per section in a zebrafish one-cell stage embryo. Genes on the y-axis as sorted into profiles 1–50 by SOM (self-organizing map), spatial position in the embryo on the x-axis. b Vegetally localized genes per sample (profiles 48–50). c Expression correlation of vegetally localized genes between two replicates. Genes on the axes are only detected in one sample. d Comparison of tomo-seq and whole-mount in situ hybridization for selected newly described vegetally localized genes, as well as the animally localized gene exd2. Scale bars are 200 µm.

Acknowledgments
This image is the copyrighted work of the attributed author or publisher, and ZFIN has permission only to display this image to its users. Additional permissions should be obtained from the applicable author or publisher of the image. Full text @ Nat. Commun.