IMAGE

FIGURE 3

ID
ZDB-IMAGE-210606-32
Source
Figures for Jaka et al., 2021
Image
Figure Caption

FIGURE 3

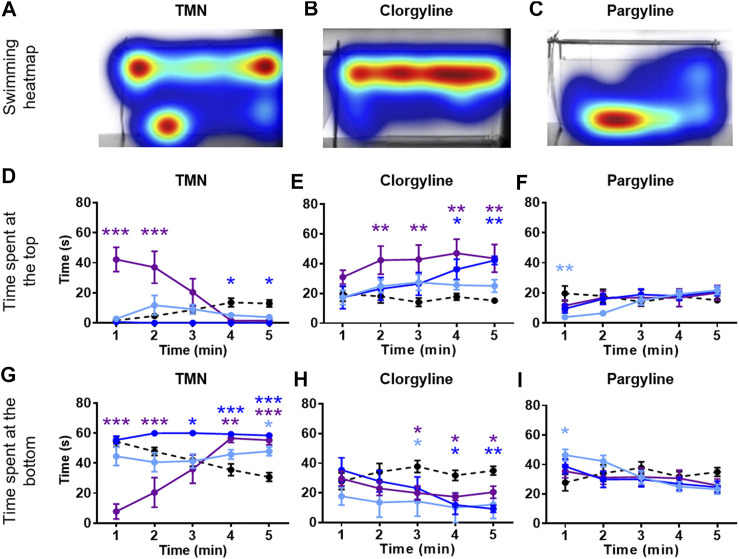
NTT results for TMN, clorgyline, and pargyline. Representative heatmaps for (A) TMN (30 mg/L) (B) clorgyline (100 mg/L), and (C) pargyline (10 mg/L) during the NTT for one zebrafish per compound are shown. The heatmaps show the minimum (dark blue) to maximum (dark red) amount of time a fish spent in each pixel. Time spent at the top and the bottom of the tank are quantified for (D and G) TMN (3, 10, and 30 mg/L), (E and H) clorgyline (10, 30, and 100 mg/L), and (F and I) pargyline (10, 30, and 100 mg/L). All compounds show anxiolytic-like effects at at least one of the concentrations and time point. Black dashed line = vehicle control; light blue = lowest concentration; blue = middle concentration; purple = highest concentration. The sample size was 12 except for control group for TMN (n = 11), 3 mg/L TMN (n = 9), 10 mg/L and 30 mg/L TMN (n = 7), 30 mg/L Clorgyline (n = 8), and 100 mg/L Clorgyline (n = 6). Data are expressed as mean ± SEM. *p < 0.05; **p < 0.01; ***p < 0.001; Abbreviations: NTT = novel tank test; TMN = 2,3,6-trimethyl-1,4-naphthoquinone.

Acknowledgments
This image is the copyrighted work of the attributed author or publisher, and ZFIN has permission only to display this image to its users. Additional permissions should be obtained from the applicable author or publisher of the image. Full text @ Front Pharmacol