IMAGE

FIGURE 4

ID
ZDB-IMAGE-210530-7
Source
Figures for Orr et al., 2021
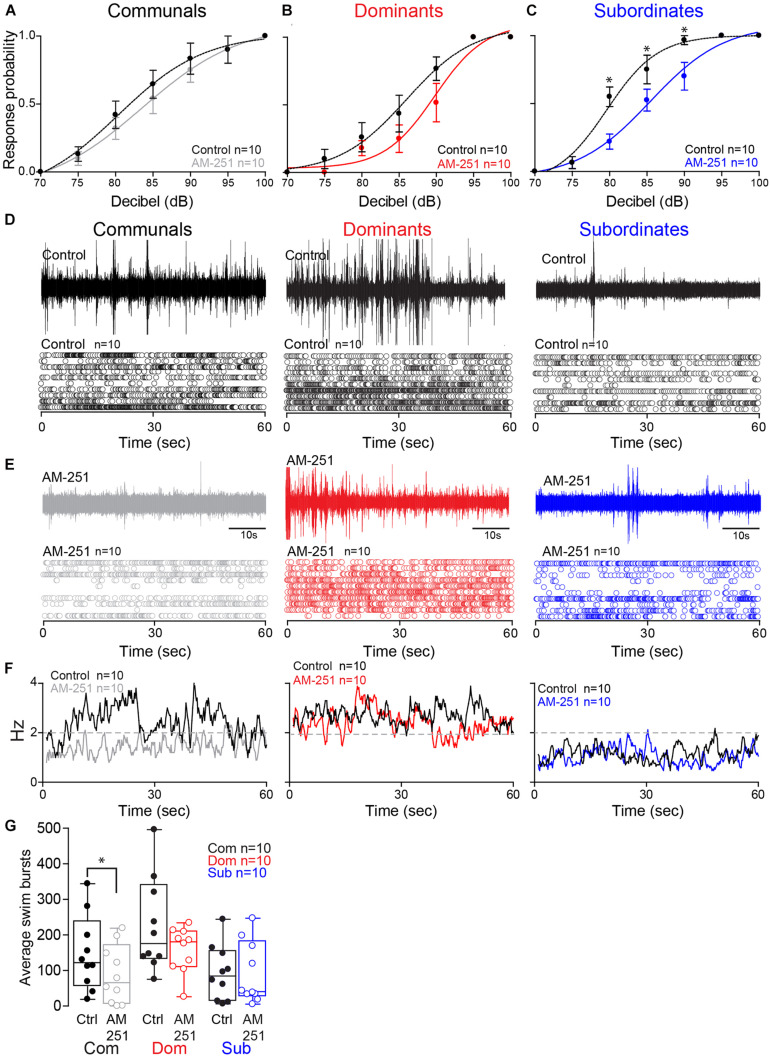
Image
Figure Caption

FIGURE 4

Effect of AM-251 on status-dependent escape probability and swim frequency. (A–C) Probability of startle escape response before (control) and after AM-251 injections for communals, dominants and subordinates, respectively. Asterisks (*p < 0.05) denote statistical difference between control and experimental condition at the specified dB level. (D,E) 1 min recoding of far field-potentials of spontaneous swimming activity before (control) and after AM-251 injections for communal, dominants and subordinates, respectively, along with respective raster plots for all animals tested. (F) Average swimming frequency for all animals tested before and after AM-251 injection. (G) Box and whiskers plots of the average number of swim bursts per 1 min for each social phenotype. Box plot parameters are defined in Figure 3G.

Acknowledgments
This image is the copyrighted work of the attributed author or publisher, and ZFIN has permission only to display this image to its users. Additional permissions should be obtained from the applicable author or publisher of the image. Full text @ Front. Behav. Neurosci.