IMAGE

FIGURE 2

ID
ZDB-IMAGE-210530-4
Source
Figures for Orr et al., 2021
Image
Figure Caption

FIGURE 2

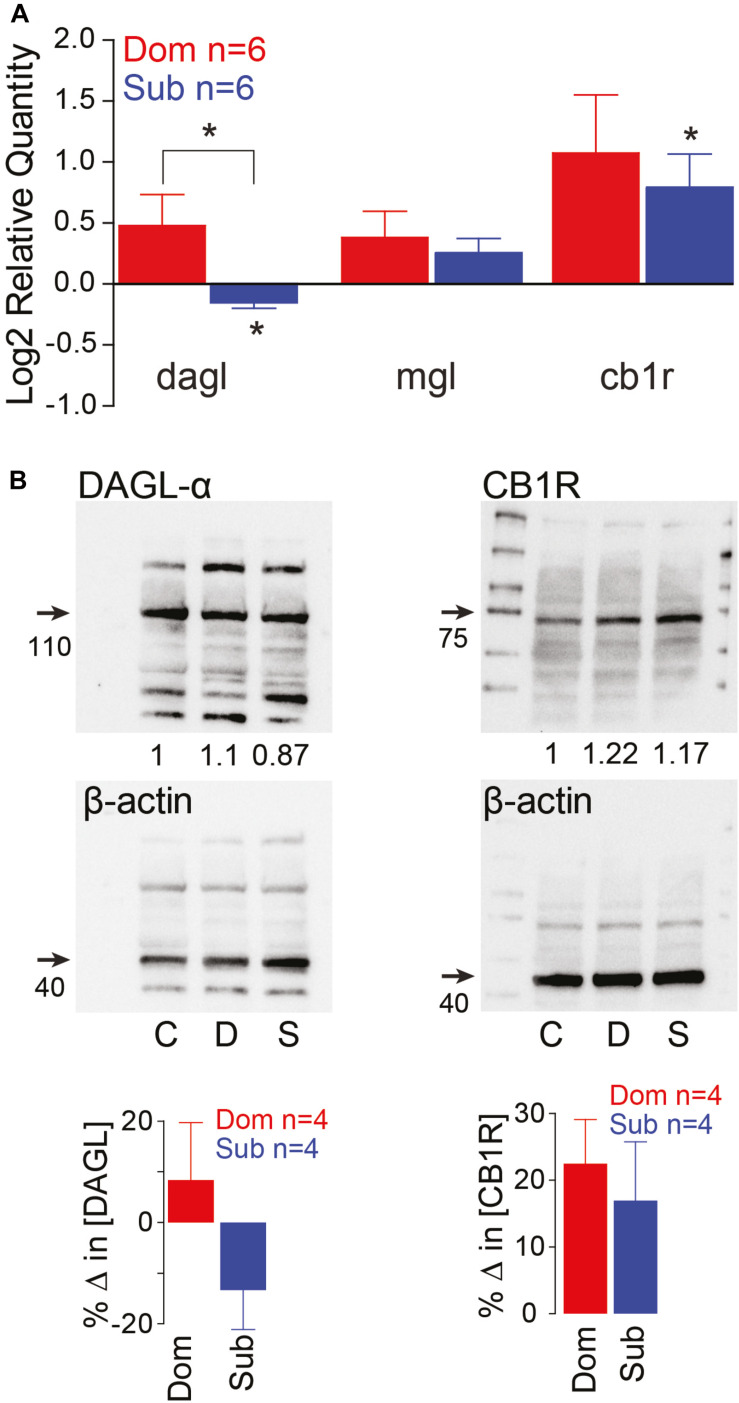
Endocannabinoid signaling pathway is socially regulated and its modulation of M-cell excitability is status-dependent. (A) qPCR gene expression analysis of ECS signaling molecules. Data of dominants and subordinates normalized to control isolates (n = 6 pairs; control isolates n = 6; Kruskal–Wallis test, *p < 0.05). (B) Western blot analysis of dagl-α and cb1 receptor. Each protein was tested concurrently with β-actin as a control. Protein expression of dominants and subordinates was normalized to communal controls as a ratio (illustrated values below each band); C, communals; D, dominants; S, subordinates. Bar graphs represent average % change in protein concentration of four replicates of samples each consisting of 10 brains normalized to WT communals.

Acknowledgments
This image is the copyrighted work of the attributed author or publisher, and ZFIN has permission only to display this image to its users. Additional permissions should be obtained from the applicable author or publisher of the image. Full text @ Front. Behav. Neurosci.