IMAGE

Fig. 2

ID
ZDB-IMAGE-210518-28
Source
Figures for De Vita et al., 2021
Image
Figure Caption

Fig. 2

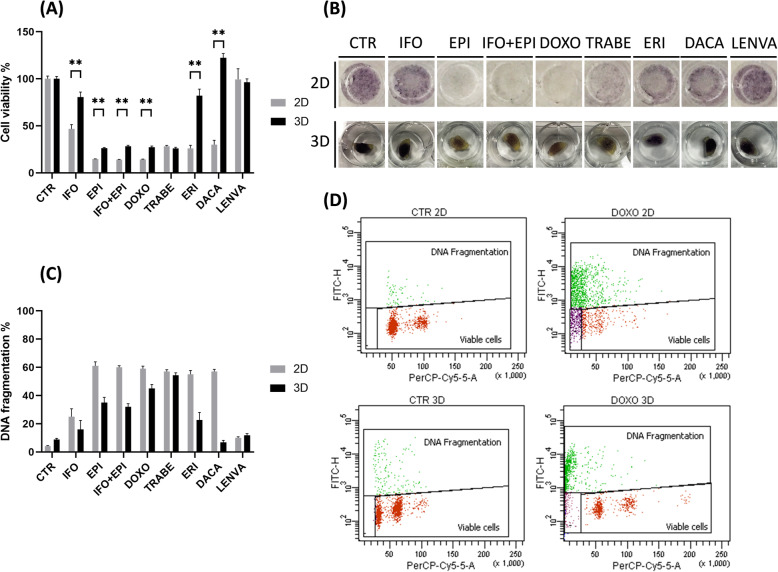
a Chemobiogram analysis of S1 primary culture seeded in 2D and 3D-collagen based scaffold and exposed to chemotherapeutics agent, untreated cells were used as control. b Representative images of 2D and 3D-collagen based scaffold S1 primary culture exposed to the tested drugs. c DNA fragmentation analysis expressed as apoptotic cells % of 2D and 3D-collagen based scaffold S1 primary culture exposed to the tested drugs. d Representative images (dot plot) of DNA fragmentation analysis obtained thought flow cytometry

Acknowledgments
This image is the copyrighted work of the attributed author or publisher, and ZFIN has permission only to display this image to its users. Additional permissions should be obtained from the applicable author or publisher of the image. Full text @ J. Exp. Clin. Cancer Res.