
Figure 5.
- ID
- ZDB-IMAGE-210510-12
- Publication
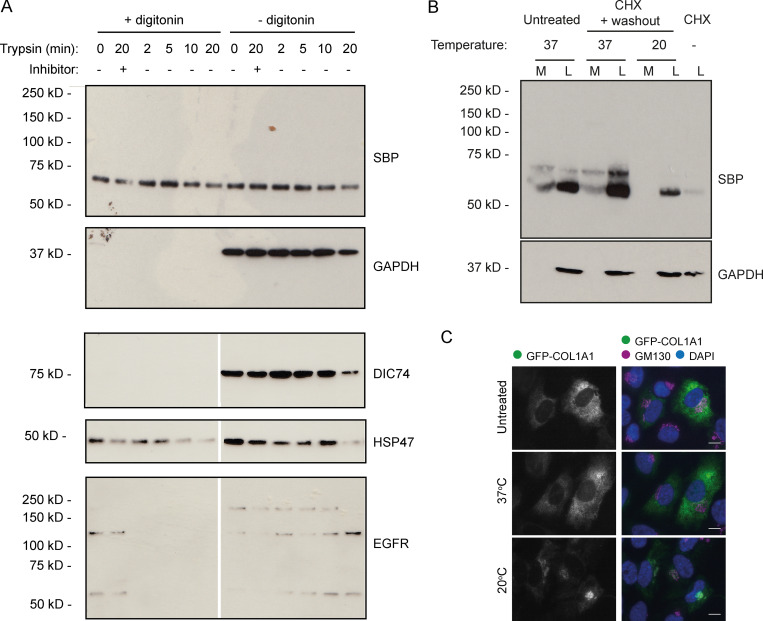
- Stevenson et al., 2021 - Giantin is required for intracellular N-terminal processing of type I procollagen
- All Figures
- Figures for Stevenson et al., 2021
|
Figure 5.