
|
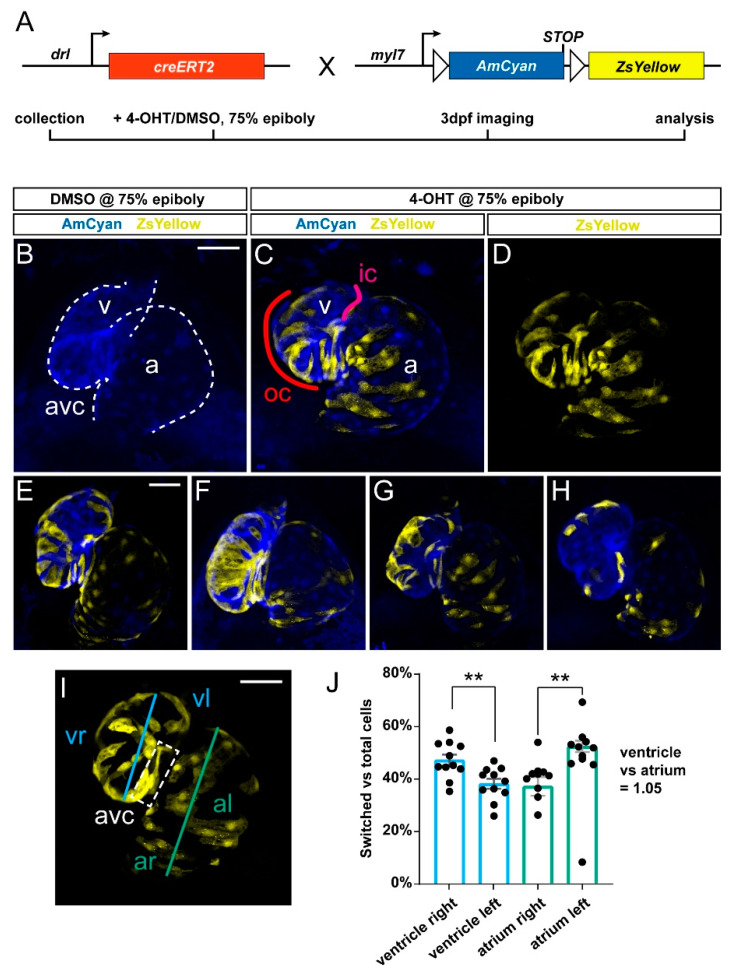
Figure 1 Predominant labeling of the first heart field (FHF)-assigned embryonic myocardium using drl:creERT2. (A) Crossing scheme of used transgenes. drl:creERT2 is expressed in the gastrulation-stage lateral plate mesoderm (LPM) progenitors and becomes gradually restricted to FHF descendants in the heart, while myl7:Switch is a cardiomyocyte-specific loxP reporter line that by default marks myocardium in AmCyan (blue) and ZsYellow (yellow) upon exposure to active Cre recombinase. Timeframe of involved experimental steps outlined below. See text for details. (B–H) Maximum intensity projections of confocal stacks taken from three dpf zebrafish embryos double-transgenic for dr:creERT2;myl7:Switch and 4-OH-Tamoxifen (4-OHT)- or DMSO control-induced at 75% epiboly. Ventral views, rostral to the top. Channel merge shown for a DMSO control heart ((B), note absence of ZsYellow due to absence of CreERT2 activity, n = 6) and a representative 4-OHT-treated heart together with ZsYellow lineage label only ((C,D), n = 11), atrium (a), ventricle (v), and atrio-ventricular canal (avc), color-annotated for predominantly second heart field (SHF)-derived inner curvature (ic), predominantly FHF-derived outer curvature (oc). Additional hearts of the imaging series are shown below (E–H); note the distribution of drl:creERT2-induced ZsYellow clones throughout the atrium and ventricle. (I,J) Quantification of clone distribution throughout atrium and ventricle, division lines for left vs. right atrium (al, ar) and ventricle (vr, vl), with boxed atrioventricular canal shown (I) that predominantly lies on the left side using this analysis and contributes to possible overrepresentation of left-sided clones in the ventricle. ** p = 0.002 for atrium, ** p = 0.0046 for ventricle, bar diagram depicts mean with error bars as SEM, significance based off differences was calculated using a two-tailed Student’s t-test (n = 11 hearts). Ratio of total linage labeling in ventricle versus atrium is almost identical (1.05). Scale bars: 50 µm.