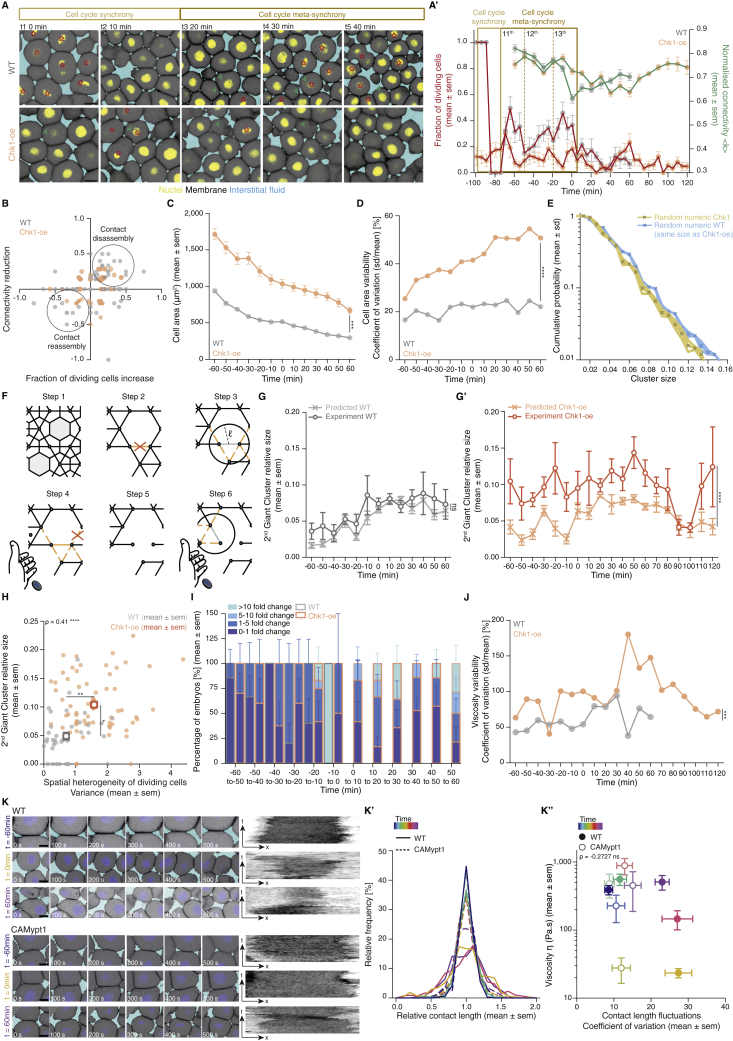
Figure Caption
Figure S5
Effects of Chk1 overexpression in cellular, topological, and material properties of the zebrafish blastoderm and role of cell contact length fluctuations on tissue viscosity, related to Figure 5
(A) Exemplary high magnification confocal images at consecutive time points during the fluidization/thickening process (10 min interval) of the central blastoderm in WT (top) and Chk1-overexpressing (oe) (bottom) embryos, during synchronous (all the cells in the field of view are dividing at the same time point) and meta-synchronous (only a fraction of the cells is dividing) cell cleavages. Nuclei are marked by H2B-GFP, membranes by membrane-RFP, and interstitial fluid by dextran. Red asterisks indicate mitotic cells, green arrowheads point at contact disassembly in meta-synchronously dividing cells of WT embryos (top) and contact maintenance in asynchronously dividing cells of Chk1-oe embryos (bottom). (A’) Plot of the fraction of dividing cells (mean ± sem) (left axis) from 2D confocal sections of WT (n = 10 blastoderm areas per time point, N = 4) and Chk1-oe (n = 8 blastoderm areas per time point, N = 4) embryos as shown in (A), and of normalized connectivity < k > (mean ± sem) (right axis) from 2D confocal sections as shown in Figures 5D and 5D’ for WT (n = 11 networks per time point, N = ) and Chk1-oe (n = 5 networks per time point, N = 5 embryos) embryos, as a function of time during the fluidization/thickening process, lasting until 60 min in WT and 120 min in Chk1-oe embryos (see STAR Methods for timing difference). Dashed lines indicate the duration of the 11th, 12thand 13thmeta-synchronous cell cycles in WT.
(B) Dot plot of the relative reduction in central blastoderm cell connectivity versus the increase in the fraction of dividing cells within 10 min intervals determined on 2D confocal sections of WT (n = 63 blastoderm areas, N = 5 embryos) and Chk1-oe (n = 94 blastoderm areas, N = 5 embryos) embryos as shown in (A) over the time period directly preceding blastoderm fluidization (1h for WT and 2h for Chk1-oe embryos).
(C) Plot of cell area (mean ± sem) as a function of time during the fluidization/thickening process in WT (n = 652 cells, N = 6 embryos) and Chk1-oe (n = 999 cells, N = 5 embryos) central blastoderms.
(D) Plot of the cell area variability expressed as coefficient of variation (sd/mean) of the data plotted in (C).
(E) Numerical check to discard size and connectivity distribution effects in the discrepancy of Chk1-oe cluster size distribution from its expected random counterpart (yellow curve in Figure 5C). The blue curve is obtained from a re-scaled version of the cluster size distribution found in WT experimental networks, in a way that the average size matches the one found in Chk1-oe experimental networks.
(F) Schematic illustration of the model designed to generate spatially correlated link/bond loss, with correlation length ℓ (at the scale of cell diameter) and correlation probability λ. In step 1, a given state of a lattice of cell contacts is presented. In step 2, a link is chosen at random and removed (orange cross). In step 3, the links in the neighborhood (orange dashed lines) of the removed link (light gray) are identified (black circle), using as a parameter the correlation length ℓ. In step 4, a biased coin is drawn with probability λ to show ‘face’, where ‘face’ removes a link from this neighborhood (orange cross). If ‘tail’ appears, the algorithm goes back to step 2 and the process is restarted. If all the links in the neighborhood are removed (step 5), a biased coin is drawn again (step 6) and if ‘face’ appears, a link that was in the neighborhood is chosen at random and the algorithm goes back to step 3, now taking this randomly chosen link as the starting point. If ‘tail’ appears, the algorithm goes back to step 2. The process starts with a complete lattice and ends when the average connectivity of the networked to be simulated is achieved (see STAR Methods for details).
(G-G’) Plots of the fraction of the network occupied by the 2nd Giant Cluster (GC) (mean ± sem) in simulated and experimental networks of WT (G) and Chk1-oe (G’) central blastoderms as a function of time during the fluidization/thickening process (WT simulated and experimental, n = 103 networks, N = 11 embryos, each; Chk1-oe simulated and experimental, n = 95 networks, N = 5 embryos).
(H) Plot of the size of the 2ndGC (mean ± sem) as a function of the spatial heterogeneity in the fraction of dividing cells (expressed as the variance in the fraction of dividing cells between the quadrants shown in Figure 5A, mean ± sem) in WT and Chk1-oe central blastoderms (WT n = 36 blastoderms, N = 5 embryos; Chk1-oe n = 66 blastoderms, N = 5 embryos; individual blastoderm values are shown in the overlaid dot plot).
(I) Plot of the percentage of central blastoderms from different embryo batches undergoing the indicated fold-changes in their viscosity within 10min intervals during the fluidization/thickening process for WT (n = embryos, N = 8 batches) and Chk1-oe (n = embryos, N = 9 batches) embryos.
(J) Plot of the central blastoderm viscosity variability expressed as coefficient of variation (sd/mean) from viscosity measurements of 8 independent WT or Chk1-oe embryo batches.
(K) Exemplary time stills (left) from high magnification confocal time series of cell-cell contact dynamics in WT (top) and CAMypt1 expressing embryos (bottom) and corresponding kymograph (right) during the fluidization/thickening process. (K’) Plot of the relative frequency of cell-cell contact lengths in WT (solid line) and CAMypt1 expressing embryos (dashed line) during the fluidization/thickening process (color coded for 30 min intervals) (n = 10 contacts, N = 4 embryos for each experimental condition and time point). (K’’) Plot of viscosity values (mean ± sem) as a function of contact length fluctuations expressed as coefficient of variation (sd/mean) from the average contact length over a 10 min period in WT (filled circle) and CAMypt1 (clear circle) expressing embryos during the fluidization/thickening process (color coded for 30 min intervals) (for contact length fluctuation: n = 10 contacts, N = 4 embryos for each experimental condition and time point; for viscosity: WT, n = 53, N = 11; CAMypt1, n = 27, N = 7; n, number of embryos, N, number of embryo batches).
Kruskal-Wallis test (G’, H), Mann-Whitney test (C, D, J), ρ Spearman correlation (H, K’’). Scale bars, 20 μm (A) 10 μm (K).