
|
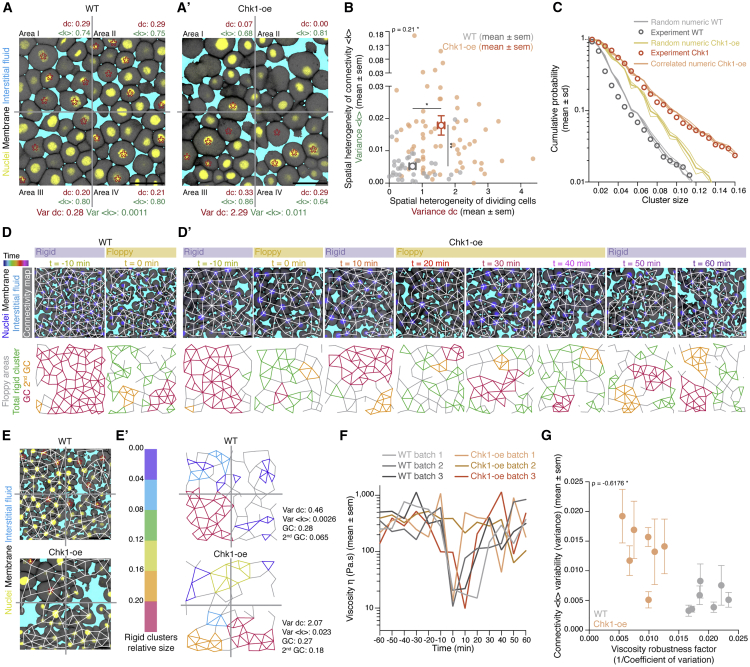
Figure 5
Uniformity in blastoderm rigidity transition relies on meta-synchronous cell divisions generating random cell connectivity changes
(A and A’) Exemplary 2D confocal sections at the 1st–2nd deep-cell layer of the central blastoderm of a WT (A) and a Chk1-overexpressing (Chk1-oe, A’) embryo during the last round of meta-synchronous cell cleavages. Interstitial fluid is marked by dextran, nuclei by H2B-GFP, and membranes by membrane-RFP. The Var for the fraction of dividing cells (red stars,
(B) Plot of the spatial heterogeneity in connectivity as a function of the spatial heterogeneity in the fraction of dividing cells, expressed as the Var in <
(C) Plot of the distribution of rigid cluster sizes p(s) other than the GC for all range of connectivity values in (i) WT and Chk1-oe experimental networks (circles), (ii) simulated random networks with size distribution identical to the experimental ones (WT, shaded gray; Chk1-oe, shaded yellow), and (iii) simulated correlated networks with size distribution identical to the experimental Chk1-oe (shaded orange) (WT n = 103 networks, N = 11 batches, Chk1-oe n = 95 networks, N = 5 batches), showing that Chk1-oe cluster size distribution is wider than the one expected from a model random network, but displays a very good fit if the model network shows spatial correlations in division/bond loss.
(D and D’) Exemplary 2D confocal sections at the 1st–2nd deep-cell layer of the central blastoderm of a WT (D) and a Chk1-oe (D’) embryo with overlaid connectivity maps (top) and their rigidity profile (bottom) at different time points during the fluidization/thickening process (color coded), marked as in (A). Floppy areas are illustrated in gray, rigid areas in green, the 2nd GC in orange, and the GC in red. Yellow- and purple-shaded areas indicate floppy and rigid blastoderms, respectively, as judged by the GC relative size.
(E) Exemplary 2D confocal sections at the 1st-2nd deep-cell layer of the central blastoderm of a WT (top) and a Chk1-oe (bottom) embryo, marked as in (D), at a fluidized state with marked mitotic cells (red stars) and overlaid connectivity maps.
(E’) Their rigidity profile is color coded for the size of the rigid clusters (fraction occupied in the total network).
(F) Plot of blastoderm tissue viscosity as a function of time for measurements from 3 independent embryo batches of WT (showing synchronous fluidization) and Chk1-oe (showing heterogeneous phases of fluidization/thickening) embryos.
(G) Plot of normalized connectivity <k> variability, expressed as the Var in normalized connectivity <k> between the quadrants (mean ± SEM) shown in (A) and (A’) as a function of a robustness viscosity factor, expressed as the inverse of coefficient of Var between the viscosity measurements (see
Kruskal-Wallis test (B), ρ Spearman correlation test (B and G). Scale bars: 50 μm in (A), (A’), (D), (D’), and (E).
See also
Reprinted from Cell, 184(7), Petridou, N.I., Corominas-Murtra, B., Heisenberg, C.P., Hannezo, E., Rigidity percolation uncovers a structural basis for embryonic tissue phase transitions, 1914-1928.e19, Copyright (2021) with permission from Elsevier. Full text @ Cell