
|
Figure 2
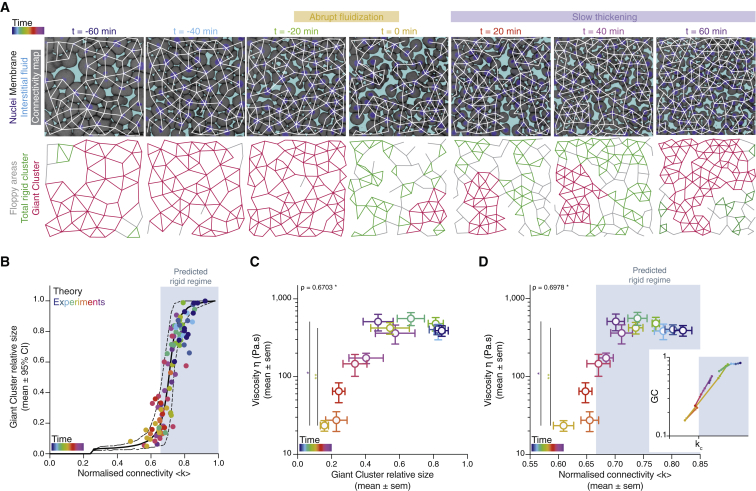
A tissue rigidity percolation transition describes the temporal blastoderm viscosity profile
(A) Exemplary 2D confocal sections at the 1st–2nd deep-cell layer of the central blastoderm with overlaid connectivity maps (top) and their rigidity profile (bottom) at consecutive time points during the fluidization/thickening process (color coded). Interstitial fluid is marked by dextran, nuclei by H2B-GFP, and membranes by membrane-RFP. Floppy areas are illustrated in gray, rigid areas in green, and the rigid GC in red. Shaded yellow and purple areas indicate the time period of tissue fluidization and thickening, respectively.
(B) Plot of the fraction of the network occupied by the GC (mean ± 95% confidence interval [CI]) as a function of normalized connectivity <k> in simulated random networks of the same size as the average size of experimental networks (black). Overlaid dot plot of the measured GC sizes as a function of the normalized connectivity <k> for experimental networks of the central blastoderm at different time points during the fluidization/thickening process (color coded for 10 min intervals) (n = 103 experimental networks, N = 11 embryo batches), agreeing with the theoretical expectation.
(C) Plot of tissue viscosity (mean ± SEM) as a function of the GC relative size (mean ± SEM) for experimental networks of the central blastoderm at different time points during the fluidization/thickening process (color coded as in B) (for viscosity n = 129 embryos, N = 12 embryo batches; for GC n = 103 blastoderms, N = 11 embryo batches). Statistical tests were performed in comparison to t = 0 min.
(D) Plot of tissue viscosity (mean ± SEM) as a function of normalized connectivity <k> (mean ± SEM) for the samples described in (C) (for viscosity n = 129 embryos, N = 12 embryo batches; for normalized connectivity <k> n = 103 blastoderms, N = 11 embryo batches). Statistical tests were performed in comparison to t = 0 min. The integrated plot illustrates the time trajectory (color coded) of the central blastoderm material phase state (relative size of GC) as a function of its connectivity (kc).
The gray-shaded region in (B) and (D) indicates the rigid regime above the kc.
Kruskal-Wallis test (C and D), ρ Spearman correlation test (C and D). Scale bars: 50 μm in (A).
See also
Reprinted from Cell, 184(7), Petridou, N.I., Corominas-Murtra, B., Heisenberg, C.P., Hannezo, E., Rigidity percolation uncovers a structural basis for embryonic tissue phase transitions, 1914-1928.e19, Copyright (2021) with permission from Elsevier. Full text @ Cell