IMAGE

Figure S2

ID
ZDB-IMAGE-210424-25
Source
Figures for Petridou et al., 2021
Image
Figure Caption

Figure S2

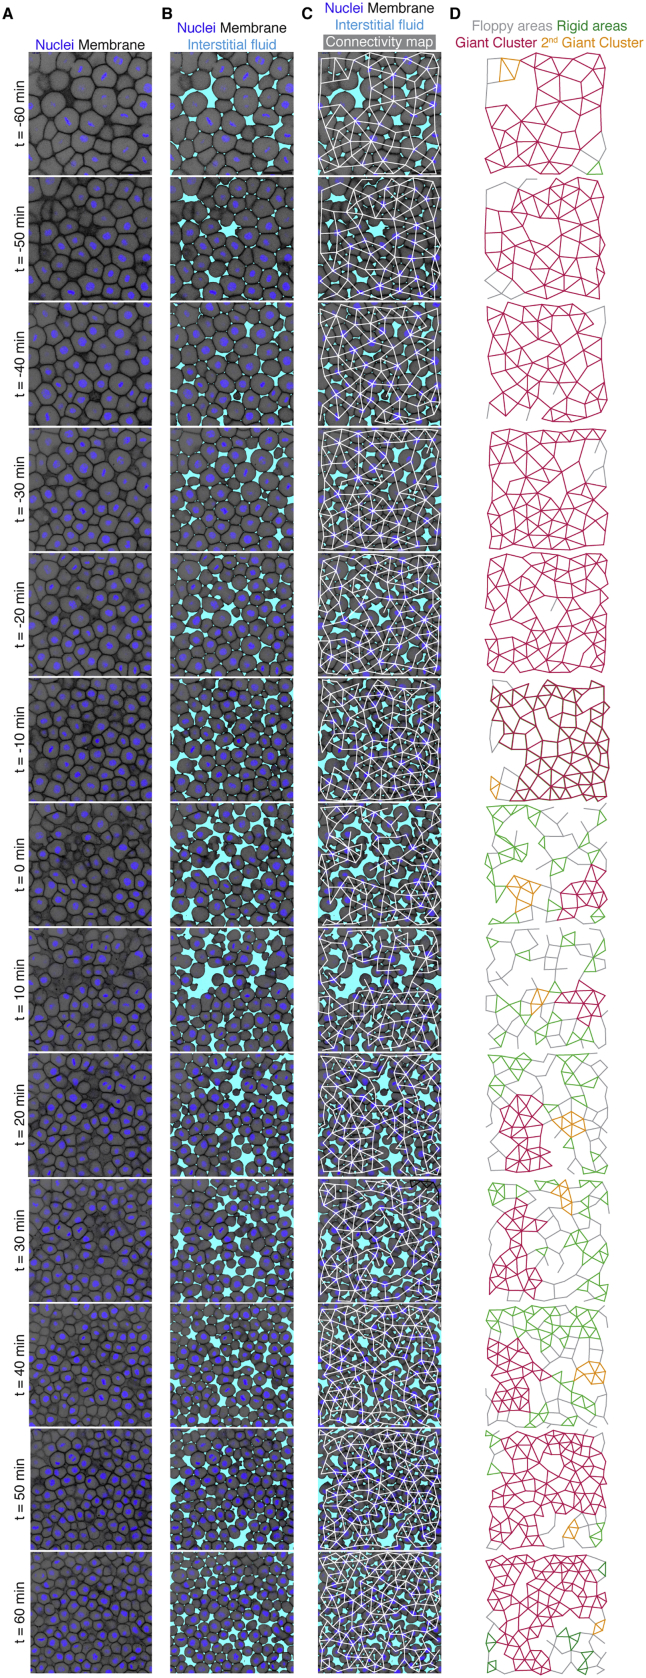
Rigidity analysis in WT embryos, related to Figure 2

(A) Confocal images of the central blastoderm of an exemplary WT embryo imaged at 1st-2nddeep cell layer with nuclei marked by H2B-GFP and membranes by membrane-RFP at consecutive time points during the fluidization/thickening process taken from a time lapse video of a WT embryo.

(B) Same images as shown in (A) with labeled interstitial fluid marked by dextran to reveal the spaces between the cells.

(C) Same images as in (B) with overlaid connectivity maps.

(D) Rigidity analysis of the connectivity maps shown in (C). Floppy areas are illustrated in gray, rigid areas in green, the Giant Cluster (GC) in red and the 2nd GC in orange.

Acknowledgments
This image is the copyrighted work of the attributed author or publisher, and ZFIN has permission only to display this image to its users. Additional permissions should be obtained from the applicable author or publisher of the image.

Reprinted from Cell, 184(7), Petridou, N.I., Corominas-Murtra, B., Heisenberg, C.P., Hannezo, E., Rigidity percolation uncovers a structural basis for embryonic tissue phase transitions, 1914-1928.e19, Copyright (2021) with permission from Elsevier. Full text @ Cell