Figure Caption
Figure S1
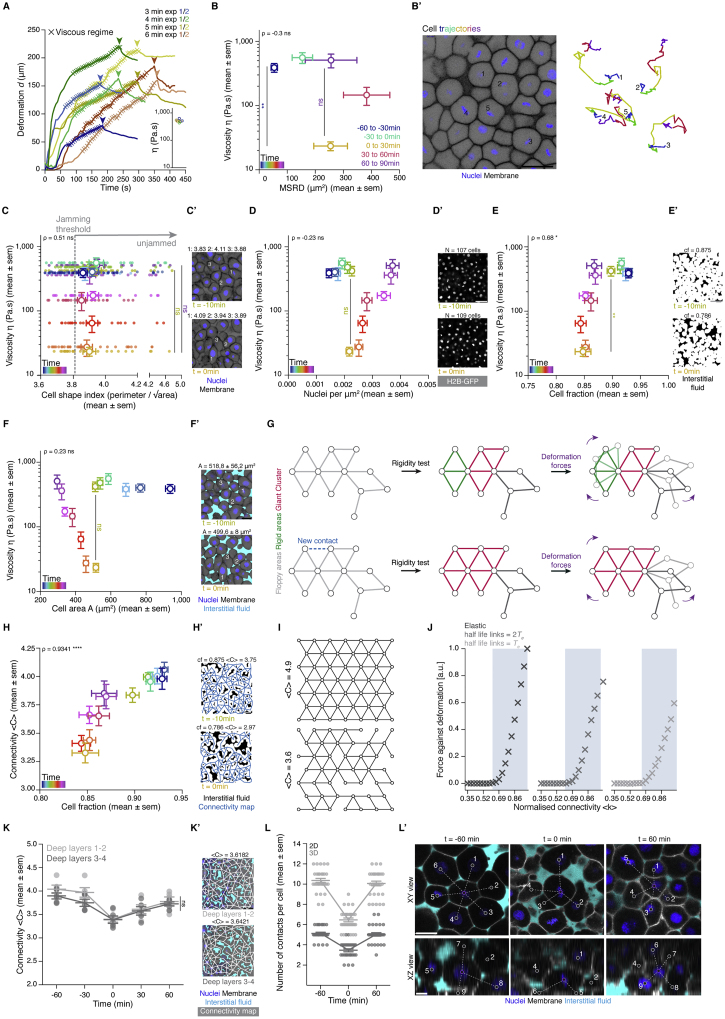
Temporal analysis of blastoderm viscosity and underlying cellular dynamics, related to Figure 1
(A) Plot of exemplary deformation (d) curves from creep and recovery aspiration experiments in the central blastoderm of sphere stage embryos (t-30min) for different aspiration times and integrated plot of the obtained viscosity values from these experiments, which found to be independent of the aspiration time. The ‘x’ signs indicate the region of the curve where the blastoderm undergoes a viscous deformation and where the slope was used for calculating the viscosity (see STAR Methods for details). Arrowheads indicate the time point of pressure release.
(B) Plot of central blastoderm tissue viscosity (mean ± sem) as a function of the mean squared relative displacement (MSRD) of the blastoderm cells (mean ± sem), during 30min intervals from different starting time points during the fluidization/thickening process (B’). Color-code indicates 30min intervals with dark blue corresponding to viscosity at t-60min and MSRD from t-60min to t-30min, green to viscosity at t-30min and MSRD from t-30min to t0min, yellow to viscosity at t0min and MSRD from t0min to t30min, red to viscosity at t30min and MSRD from t30min to t60min and purple to viscosity at t60min and MSRD from t60min to t90min (for viscosity n = 53 embryos, N = 12 embryo batches; for MSRD n = 26 cell doublets, N = 8 embryos). Statistical tests were performed in comparison to t0min. (B’) Exemplary 2D confocal section at the 1st-2nd deep cell layer of the blastoderm at t-60min (left) and color-coded 3D cell trajectories (right) for five representative cells. Nuclei are marked by H2B-GFP and membranes by membrane-RFP.
(C) Plot of central blastoderm tissue viscosity (mean ± sem) as a function of the cell shape index (mean ± sem) (n = 390 cells, N = 3 embryos). Overlaid dot plot shows individual measurements of the cell shape index for each time point. The gray dashed line indicates the theoretical cell shape index value at which a jamming transition is predicted in epithelial tissues. Statistical tests were performed in comparison to t0min. (C’) Exemplary 2D confocal sections at the 1st-2nddeep cell layer of the blastoderm marked as in (B’) at t-10min and t0min, with 3 exemplary cell shape index measurements for each.
(D) Plot of central blastoderm tissue viscosity (mean ± sem) as a function of nuclei density (mean ± sem) (n = 103 blastoderms, N = 11 embryo batches). Statistical test was performed in comparison to t0min. (D’) Exemplary 2D confocal sections at the 1st-2nd deep cell layer of the blastoderm with marked nuclei by H2B-GFP at t-10min and t0min with indicated number of nuclei (N).
(E) Plot of central blastoderm tissue viscosity (mean ± sem) as a function of cell fraction (mean ± sem) (n = 78 blastoderms, N = 6 embryo batches). Statistical test was performed in comparison to t0min. (E’) Exemplary binary images from the 2D confocal sections shown in (D) with marked interstitial fluid by dextran at t −10min and t 0min with indicated cell fraction (cf.) measurements.
(F) Plot of central blastoderm tissue viscosity (mean ± sem) as a function of cell area (mean ± sem) (n = 652 cells, N = 6 embryos) during the fluidization/thickening process (color-coded for 10min intervals). Statistical test was performed in comparison to t0min. (F’) Exemplary cell area A measurements from the 2D confocal sections shown in (C) with nuclei marked by H2B-GFP, membranes by membrane-RFP and interstitial fluid by dextran, at t-10min and t0min.
(G) Rigidity analysis of an exemplary network. Two rigid clusters (green, red) and a floppy area (gray) are identified. The shaded areas of the network depict potential response to deformation forces that would require no energy cost. Adding a single link can change the overall response of the network to deformation forces due to the sharp increase in the size of the Giant Cluster (GC) (red).
(H) Plot of connectivity < C > (mean ± sem) as a function of cell fraction cf. (mean ± sem) obtained from the same 2D confocal sections of the central blastoderm during the fluidization/thickening process, color-coded for 10min intervals (n = 78 blastoderms, N = 6 embryo batches). (H’) Exemplary binary images from the 2D confocal sections shown in (D) with marked interstitial fluid by dextran and overlaid connectivity maps at t-10min and t0min with indicated cf. and < C > values.
(I) Two exemplary triangular lattices of N = 46, L = 7, one fully connected (top panel) with < C > = 4.9, and the other one partially connected (bottom panel) with < C > 3.6, N, number of nodes, L, side length. Numerical construction of lattices starts with a fully connected lattice of certain L followed by the random removal of links until the desired average connectivity is achieved.
(J) Plots of the linear regime of the response of the lattice against deformations as a function of normalized connectivity for an elastic lattice (left), viscous lattice with bonds half lifetime τ = 2Te (middle) and τ = Te (right), with Te being the simulation time. A permanent displacement of δx = 0.01 a.u. is applied to the top layer of nodes, while the bottom layer remains fixed - (see Figure 1H). The viscosity for viscous lattices is computed from the force exerted by the bottom layer against the deformation. The linear increase of the resistance exerted by the network starts at the critical point of the rigidity percolation (shaded area, predicted rigid regime). Parameters of the simulation are given in STAR Methods.
(K) Dot plot of individual connectivity < C > values obtained from 2D confocal sections of the same blastoderm at the 1st-2nd deep cell layer and at the 3rd-4thdeep cell layer overlaid with a line plot of the mean ± sem as a function of time (n = 50 blastoderm networks, N = 5 embryos). (K’) Exemplary blastoderm confocal sections (marked as in F) at the 1st-2nd(top) and the 3rd-4th(bottom) deep cell layer with overlaid connectivity maps and indicated < C > values.
(L) Dot plot of the number of contacts per cell as counted from XY (2D) and XYZ (3D) confocal views (mean ± sem) as a function of time (n = 30 cells, N = 3 embryos for each time point). (L’) Exemplary XY and XZ blastoderm confocal sections marked as in (F’). Purple circle indicates the cell chosen for counting its cell-cell contacts, gray circles indicate neighboring cells in contact to the chosen cell.
Kruskal-Wallis test (B, C), Mann-Whitney test (D-F, H), ρ Spearman correlation (B-F, H). Scale bars, 50 μm (B’, D’, E’, H’, K’), 20 μm (C’, F’, L’).