
|
Figure 1
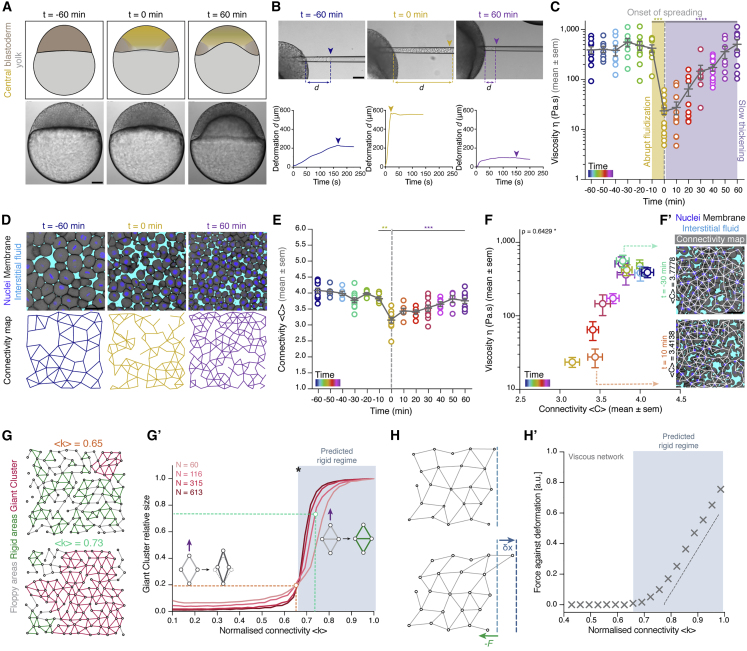
Blastoderm cell connectivity as a potential control parameter of a tissue rigidity percolation transition
(A) Schematic representations (top) and bright-field single-plane images (bottom) of an exemplary embryo before (t = −60 min), at the onset (t = 0 min), and after blastoderm spreading (t = 60 min). The yellow-shaded region represents the central blastoderm.
(B) Exemplary bright-field images of creep and recovery aspiration experiments in the central blastoderm at the stages described in (A) (top) and corresponding deformation (
(C) Dot plot of individual viscosity values of the central blastoderm obtained from the aspiration experiments shown in (B) overlaid with a line plot of the mean ± SEM as a function of time (color coded for 10 min intervals) (n = 129 embryos, N = 12 embryo batches). Gray dashed line indicates the onset of blastoderm spreading during the fluidization (yellow shade)/thickening (purple shade) process.
(D) Exemplary 2D confocal sections at the 1st–2nd deep-cell layer of the blastoderm (top) and their connectivity maps (bottom) at the stages described in (A). Interstitial fluid is marked by dextran, nuclei by H2B-GFP, and membranes by membrane-red fluorescent protein (RFP).
(E) Dot plot of individual connectivity <C> values (number of contacts/cell) obtained from central blastoderm confocal sections overlaid with a line plot of the mean ± SEM as a function of time (color coded) (n = 11 embryos for time points −60, −30, 0, 30, and 60 min; n = 6 embryos for all other time points; N = 11 embryo batches). Gray dashed line indicates the onset of blastoderm spreading.
(F) Plot of the central blastoderm viscosity values (mean ± SEM) as a function of connectivity <C> (mean ± SEM) over time (color coded as in E; for viscosity n = 129 embryos, N = 12 embryo batches; for connectivity n = 103 blastoderms, N = 11 embryo batches).
(F’) Two exemplary blastoderm confocal sections (marked as in D) with overlaid connectivity maps displaying slightly different connectivity, but by an order of magnitude different viscosity values.
(G) Exemplary simulated networks with normalized connectivity <k> values above (green line in G’) and below (orange line in G’) the critical point (asterisk in G’) of the rigidity percolation transition. Floppy areas are illustrated in gray, rigid areas in green, and the giant cluster (GC) in red.
(G’) Plot of the fraction of the network occupied by the GC as a function of normalized connectivity <k> in simulated random 2D triangular lattices of different sizes (N, number of nodes). The gray-shaded area indicates the network rigid regime above the critical connectivity point (kc, black asterisk). The schematics illustrate how, under the same deformation force (purple arrow), a floppy (left, costing zero energy) or rigid (right, costing non-zero energy due to its central bond) cluster of nodes would deform.
(H) Schematic diagram of the force response (F, green arrow) for set deformation (δx, blue arrow) induced by a small displacement of the edge layer of viscous 2D networks.
(H’) Plot of the force response illustrated in (H) for viscous 2D networks of size N ∼ 250 nodes, as a function of normalized connectivity <k>. Bond half-life time τ is 2Te, where Te is the number of simulation time steps. The gray-shaded area indicates the rigid regime above the kc, for which viscosity grows linearly as a distance from the critical point.
Kruskal-Wallis test (C and E), ρ Spearman correlation test (F). Scale bars: 100 μm in (A) and (B) and 50 μm in (D) and (F’).
See also
Reprinted from Cell, 184(7), Petridou, N.I., Corominas-Murtra, B., Heisenberg, C.P., Hannezo, E., Rigidity percolation uncovers a structural basis for embryonic tissue phase transitions, 1914-1928.e19, Copyright (2021) with permission from Elsevier. Full text @ Cell