
|
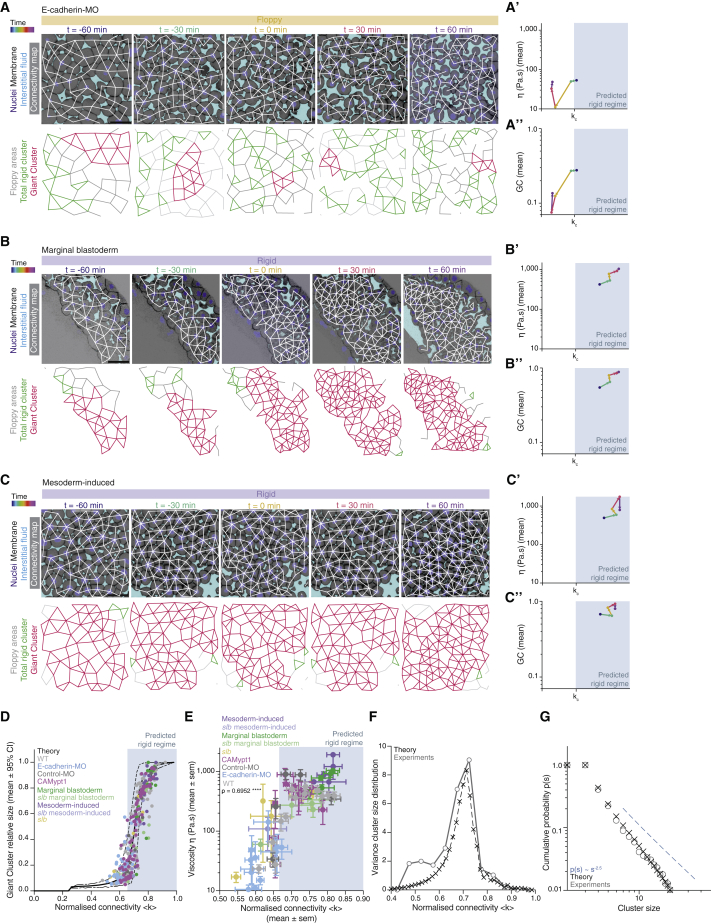
Figure 3
The blastoderm connectivity profile identifies key hallmarks of criticality during its rigidity percolation PT
(A–C) Exemplary 2D confocal sections at the 1st–2nd deep-cell layer of the central blastoderm of an
(A’, B’, and C’) Plots of the time trajectory (color coded) of blastoderm viscosity (mean) as a function of its normalized connectivity <k> for
(A’’, B’’, and C’’) Plots of the time trajectory (color coded) of the GC relative size as a function of its normalized connectivity <k> for the samples described in (A’), (B’), and (C’).
(D) Plot of the fraction of the network occupied by the GC (mean ± 95% CI) as a function of normalized connectivity <k> in simulated random networks of the same size as the average size of WT experimental networks (black). Overlaid dot plot of the measured GC size as a function of the normalized network connectivity <k> of the central blastoderm in WT (n = 103, N = 11),
(E) Plot of central blastoderm tissue viscosity (mean ± SEM) as a function of normalized connectivity <k> (mean ± SEM) for the experimental networks described in (D) (for viscosity: central blastoderm of WT n = 129, N = 11;
(F) Plot of the variance (Var) of the distribution of rigid cluster sizes p(s) other than the GC, as a function of their normalized connectivity <k>, in simulated networks of the same size as the average size of experimental networks (black) and in the experimental networks described in (D) (gray) (except marginal networks), showing divergence at the critical point, with good theory-experiment agreement.
(G) Plot of the cumulative distribution of rigid cluster sizes p(s) other than the GC near the critical point. The numerical experiment shows the scaling behavior of cluster size distribution p(s) for networks of arbitrary large size (∼1,200 nodes). The overlaid plot shows the cluster size distribution near criticality for real networks, showing excellent agreement with predictions. The dashed line shows a power-law p(s) ∼ s−2.5.
The gray-shaded regions at the plots indicate the rigid regime above the theoretical kc.
ρ Spearman correlation test (E). Scale bars: 50 μm in (A)–(C).
See also
Reprinted from Cell, 184(7), Petridou, N.I., Corominas-Murtra, B., Heisenberg, C.P., Hannezo, E., Rigidity percolation uncovers a structural basis for embryonic tissue phase transitions, 1914-1928.e19, Copyright (2021) with permission from Elsevier. Full text @ Cell