
|
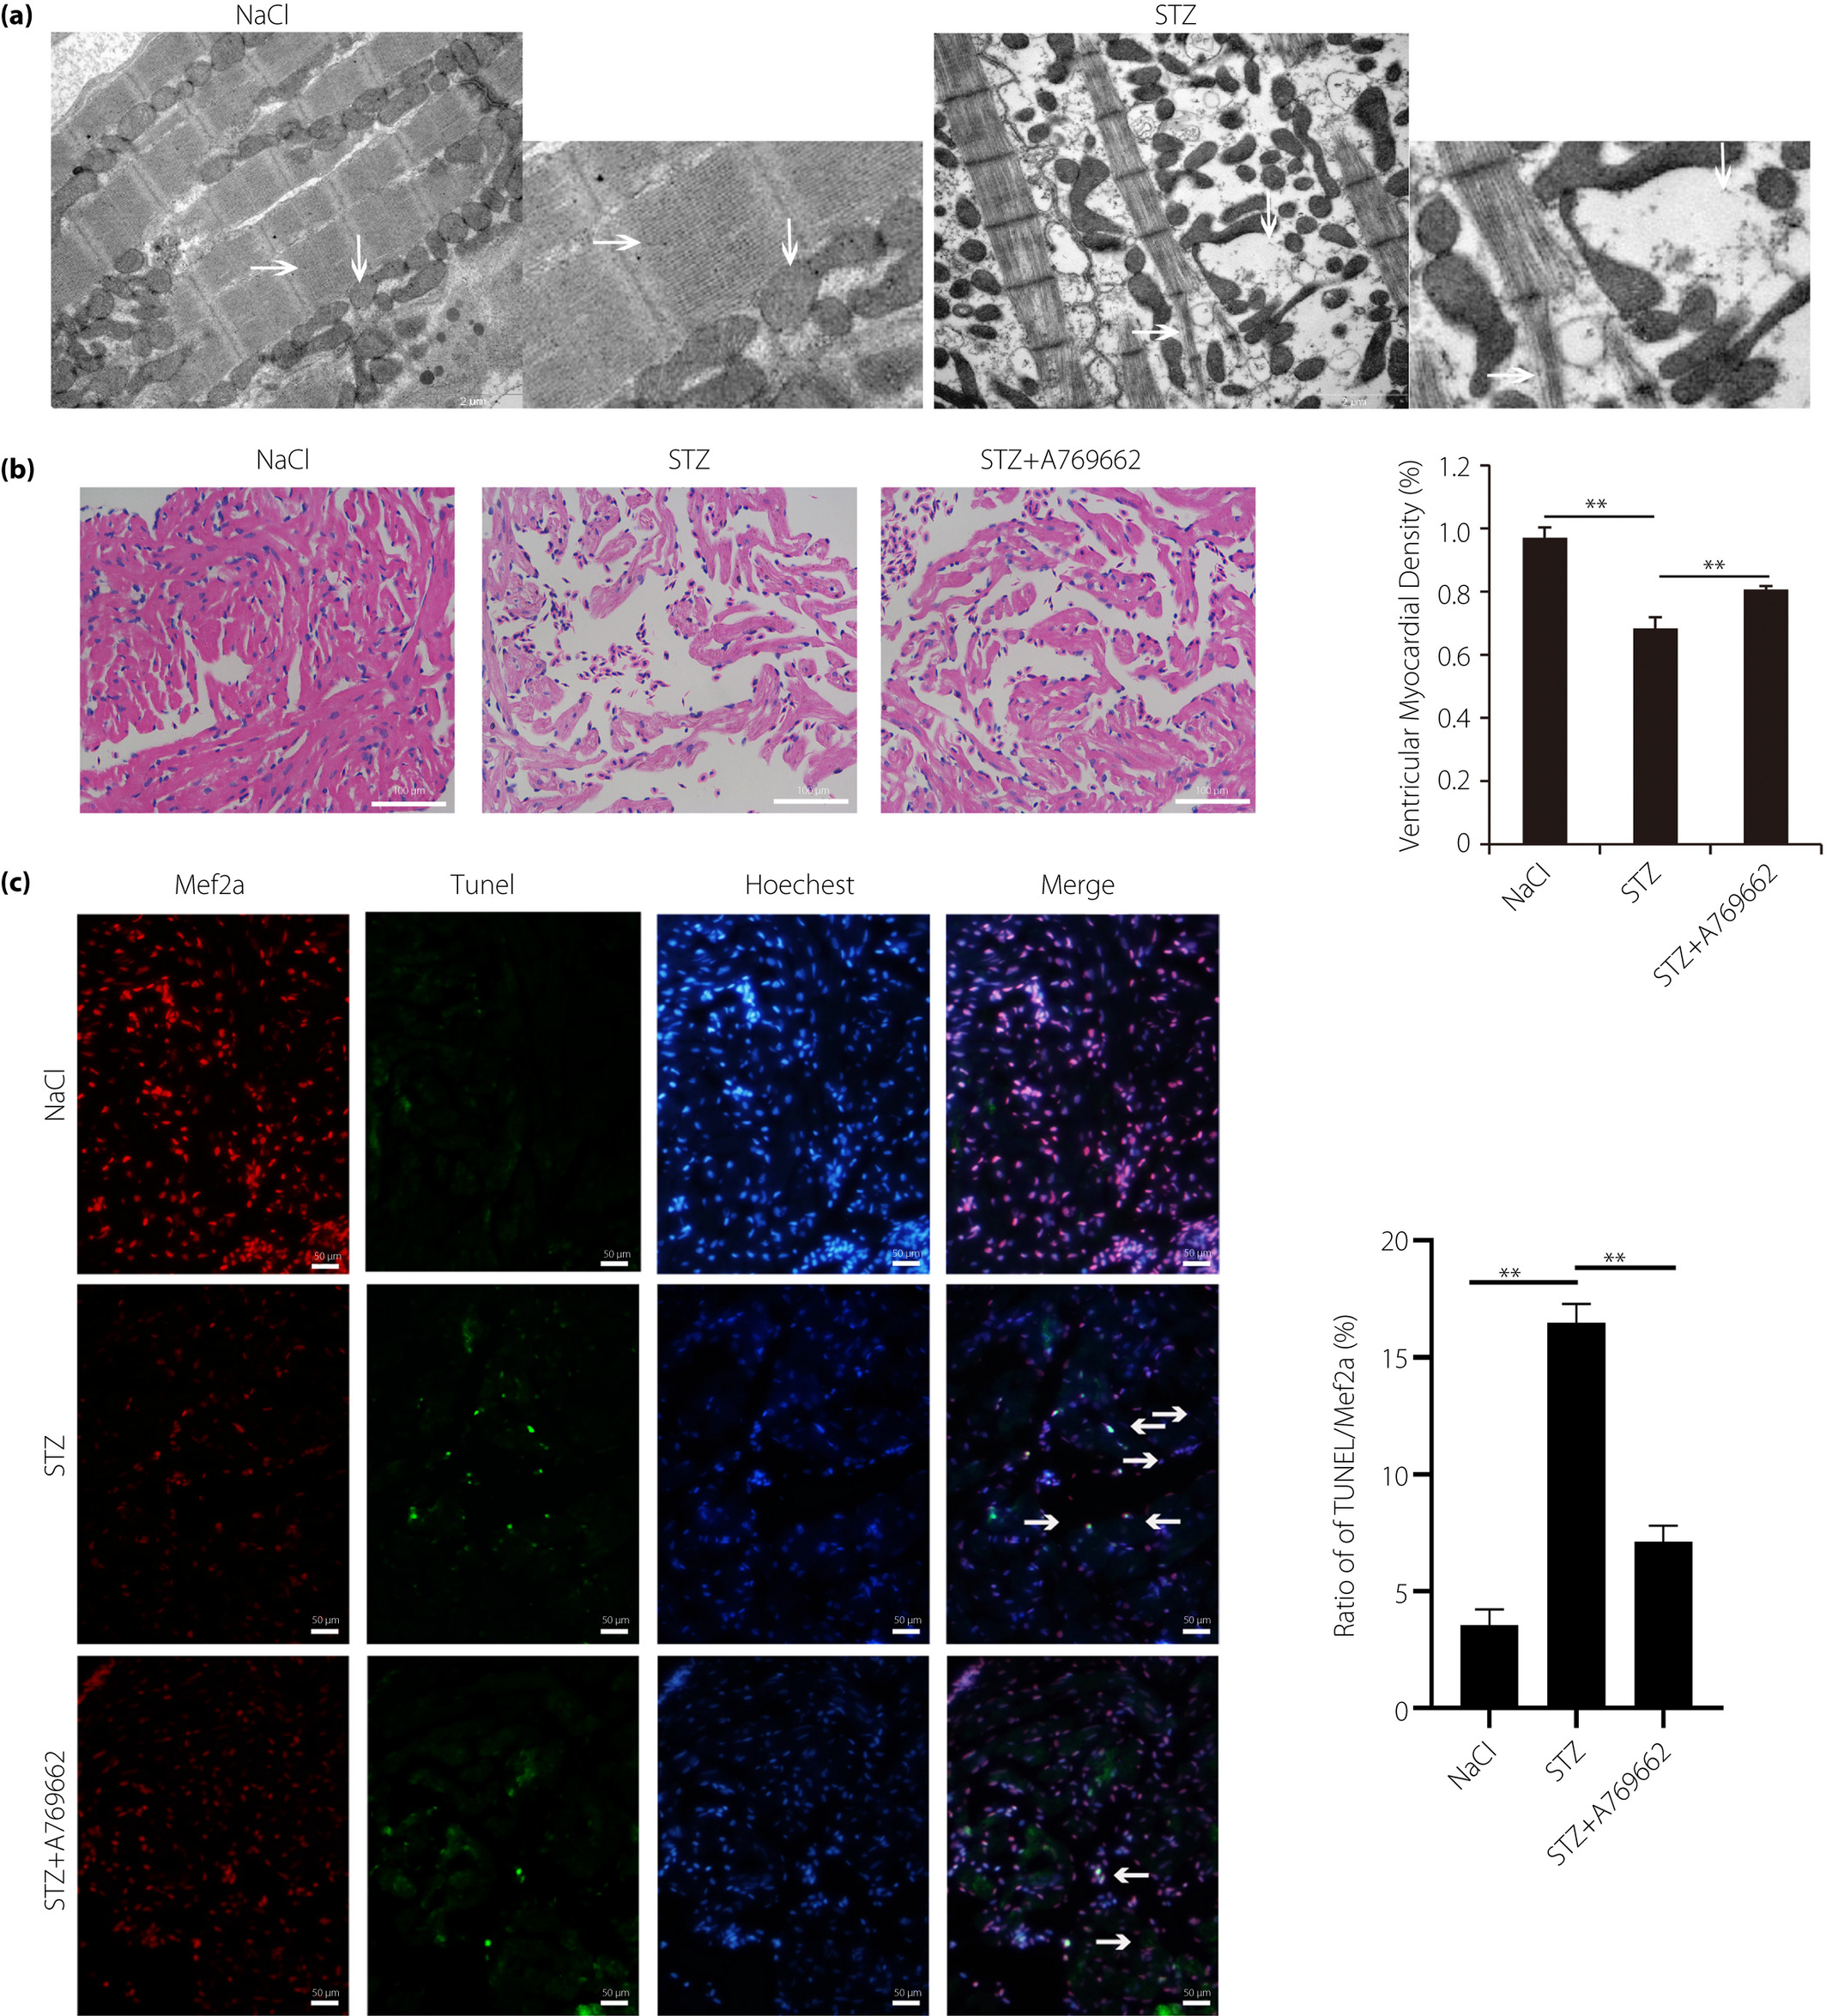
Fig. 3 Hyperglycemia induced muscular disarray, myofibril loss, vacuolization, mitochondrial condensation and apoptosis activation. (a) Transmission electron microscopy image verified muscular disarray, myofibril loss, vacuolization and mitochondrial condensation in hyperglycemic zebrafish compared with the control group (n = 21 field, repeated five times); scale bars, 2 μm. (b) Hematoxylin–eosin staining analysis of the heart in hyperglycemic zebrafish and A769662 intervention zebrafish compared with the control group after 21 days; scale bars, 100 μm. Quantification analysis of ventricular myocardial density in hematoxylin–eosin‐stained hearts between the three groups. (c) Terminal deoxynucleotidyl‐transferase‐mediated dUTP nick‐end‐labeling (TUNEL) assay analysis of cell apoptosis in the heart of hyperglycemia zebrafish and A769662 intervention zebrafish compared with the control group zebrafish; scale bars, 50 μm. Each experiment was repeated a minimum of three times. **Highly significant difference (P < 0.01) in a two‐tailed Student’s t‐test. STX, streptozocin.