
|
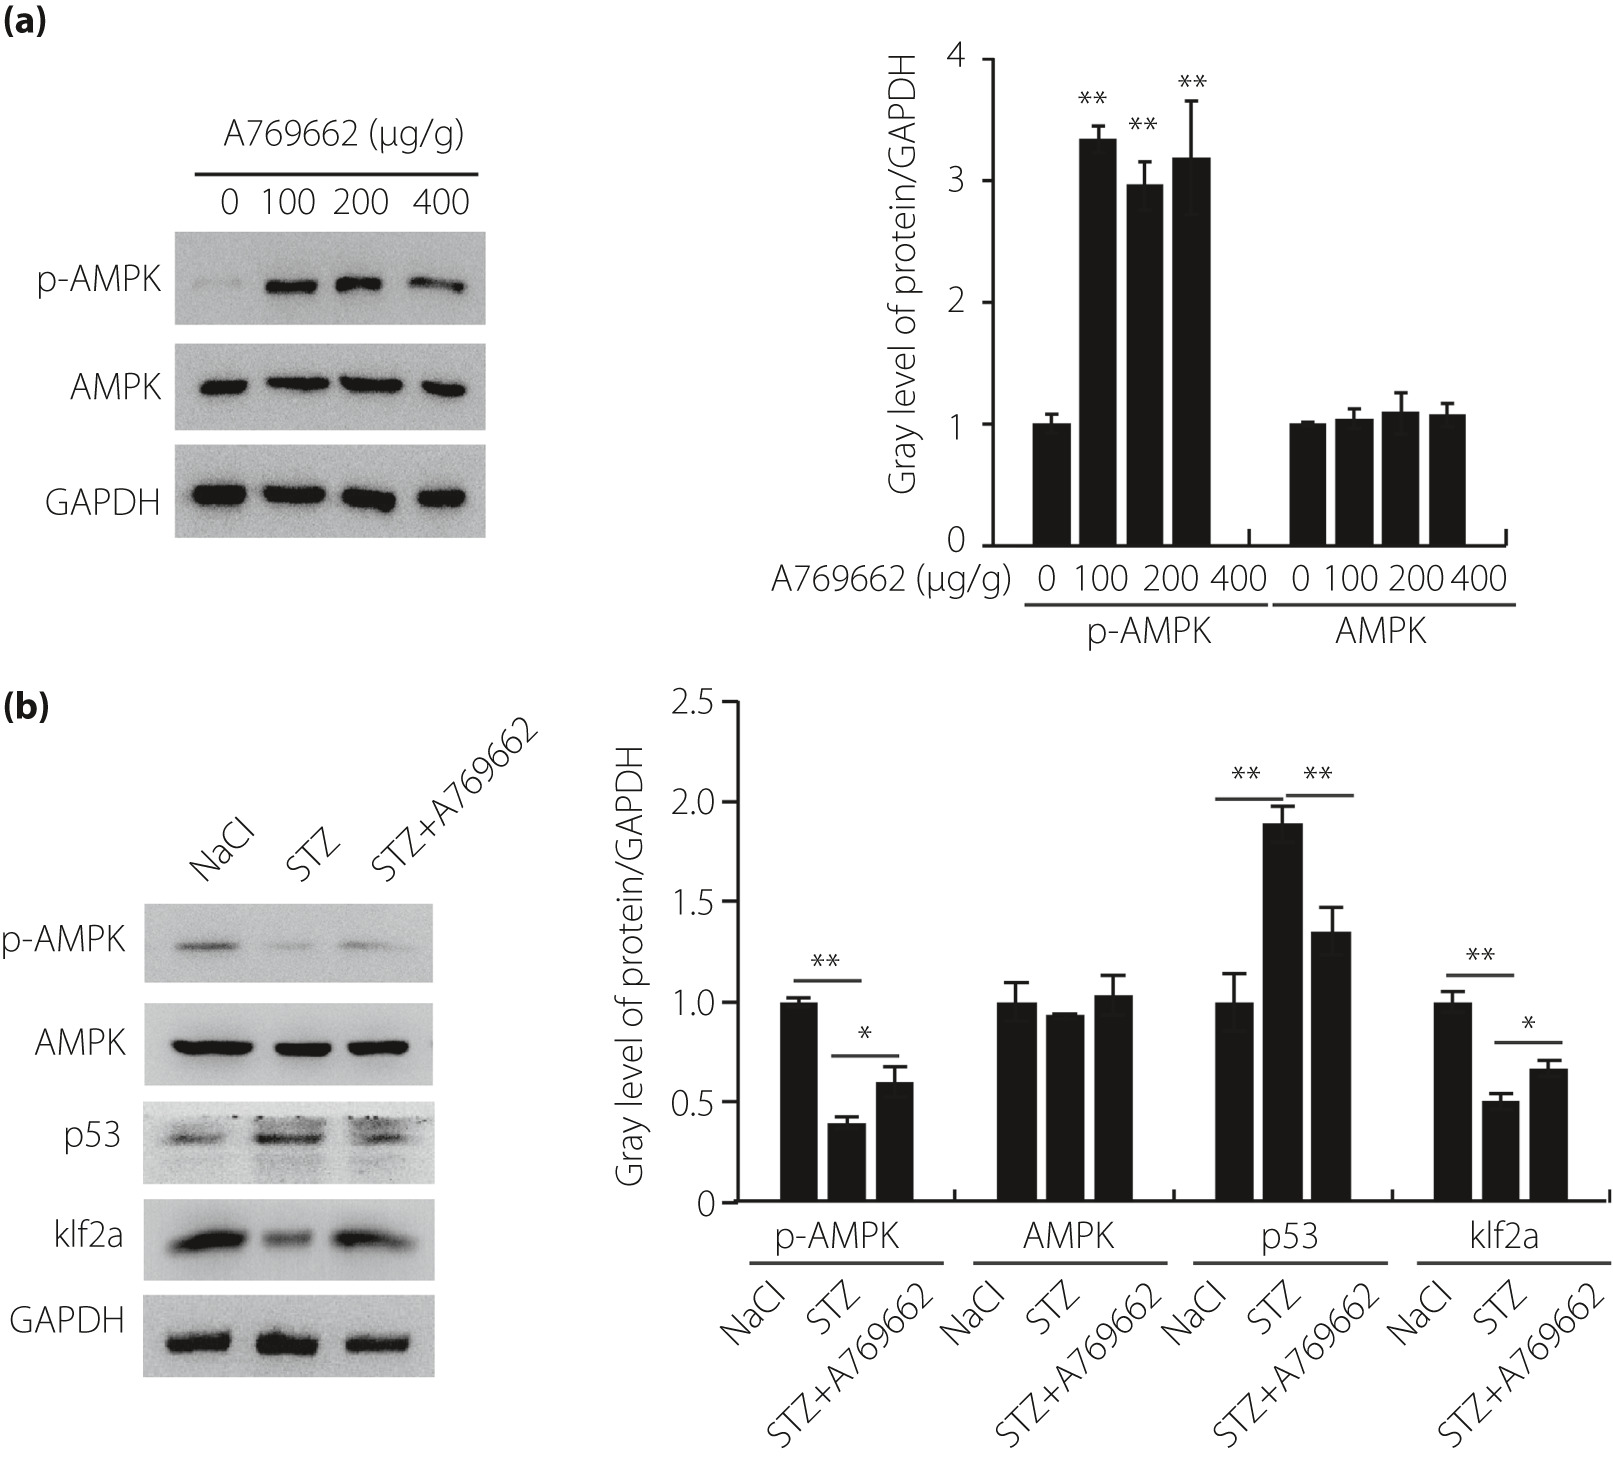
Fig. 2 The adenosine monophosphate‐activated protein kinase (AMPK) pathway was involved in the hyperglycemic zebrafish. (a) Real‐time polymerase chain reaction and western blot analysis of the expression of AMPK in different concentrations of A769662 (n = 21 fish per group). (b) Real‐time polymerase chain reaction and western blot analysis of the expression of AMPK, p53 and Krüppel‐like factor 2a (klf2a) in hyperglycemic zebrafish and A769662 intervention zebrafish compared with the control group (n = 21 fish per group). Each experiment was repeated a minimum of three times. *Statistically significant difference (P < 0.05), **Highly significant difference (P < 0.01) in a two‐tailed Student’s t‐test. GAPDH, glyceraldehyde 3‐phosphate dehydrogenase; p‐AMPK, phospho‐adenosine monophosphate‐activated protein kinase; STX, streptozocin.