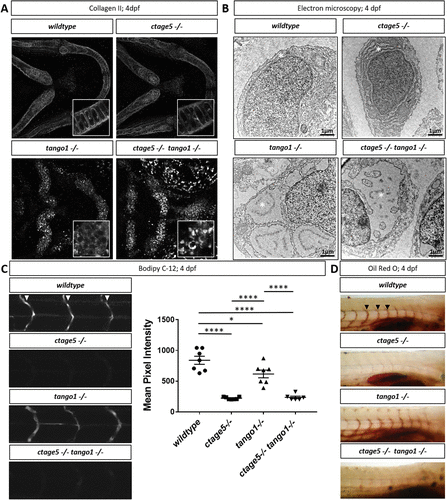
Fig. 3 Trafficking differences in ctage5 vs. tango1 mutant embryos. (A) Representative 40× images showing collagen 2 wholemount immunohistochemistry in 4dpf larvae chondrocytes (n = 3–4 per group). Inserts are 40× images with 3× zoom and cropped to show higher-resolution chondrocyte collagen 2 staining. (B) Representative electron microscopy images of endoplasmic reticulum (*) in 4dpf larvae chondrocytes (n = 3 per group). (C) Representative images and quantification of BODIPY C-12 fluorescence in the intersegmental vessels (arrowheads; one-way ANOVA, F = 39.36, p < 0.0001). (D) Representative images of Oil Red O staining for lipids in 4dpf zebrafish larvae intersegmental vessels (arrowheads). * = p < 0.05, **** = p < 0.0001.
Image
Figure Caption
Figure Data
Acknowledgments
This image is the copyrighted work of the attributed author or publisher, and
ZFIN has permission only to display this image to its users.
Additional permissions should be obtained from the applicable author or publisher of the image.
Full text @ Mol. Biol. Cell

