
|
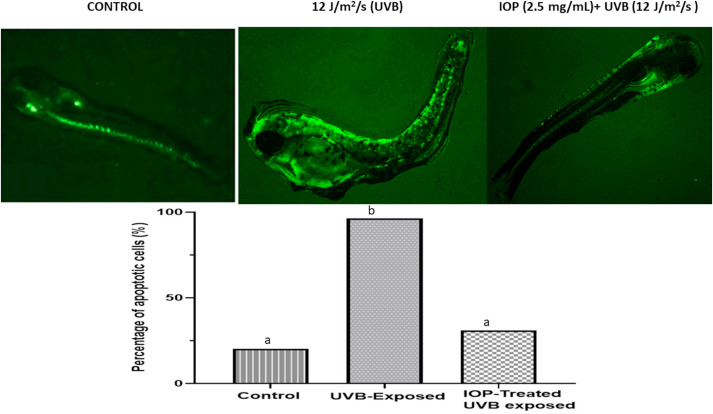
Fig. 2 Acridine orange (AO) staining of zebrafish embryos (5 dpf): Above: Acridine orange staining pics for 5dpf zebrafish for the three groups; control, UVB-exposed, IOP treated UVB-exposed, showing intensive green fluorescence as significant uptake of AO dye due to cellular and DNA damage. Below: Histogram generated by Image J analysis showing the percentage of apoptotic cells in the three groups. Apoptosis was significantly high in the UVB-exposed group in comparison to control and IOP-treated UVB-exposed group. Different letters represent statistically significant differences (ANOVA, P < 0.0001).