
Image
|
Figure Caption
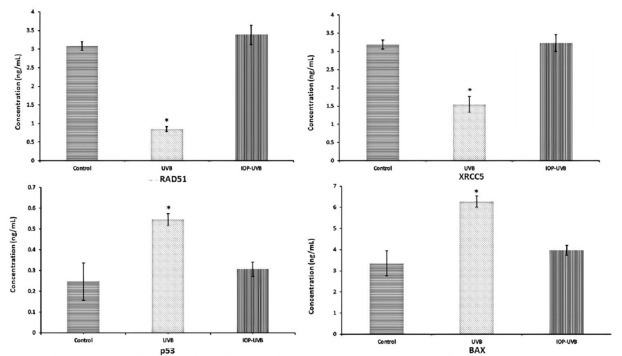
Fig. 6 Sandwich ELISA analysis depicting the concentration of XRCC5, RAD51, p53, and BAX in control, UVB-exposed and IOP-UVB-exposed zebrafish larval pools (7 dpf, 10 larvae/pool/group). The levels of XRCC5 and RAD51 were significantly decreased inUVB exposed group compared to IOP-treated UVB-exposed group, whereas p53 and BAX levels were significantly increased in the UVB-exposed groups. Data is shown for a total of 120 zebrafish larvae/group. The readings were recorded in duplicates at 450 nm. ∗ signifies a statistical significant value at p < 0.05.
Acknowledgments
This image is the copyrighted work of the attributed author or publisher, and
ZFIN has permission only to display this image to its users.
Additional permissions should be obtained from the applicable author or publisher of the image.
Full text @ Heliyon