
Image
|
Figure Caption
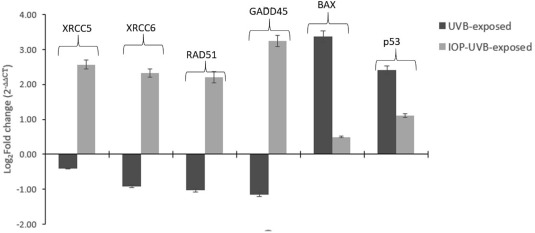
Fig. 5 qRT-PCR bar graphs showing the log2 fold change in the gene expression in UVB-exposed and IOP-treated UVB exposed groups (5 dpf) compared to control (set at 0). Significant upregulation was observed in GADD45, RAD51, XRCC5, and XRCC6 in the IOP-treated UVB-exposed group (Kruskal-Wallis test, H = 32.31, p < 0.001) compared to only UVB-exposed group. UVB exposed group showed significant upregulation of p53 and BAX genes (p < 0.0001) that indicated enhanced apoptosis and cell death leading in zebrafish embryos.
Acknowledgments
This image is the copyrighted work of the attributed author or publisher, and
ZFIN has permission only to display this image to its users.
Additional permissions should be obtained from the applicable author or publisher of the image.
Full text @ Heliyon