
Image
|
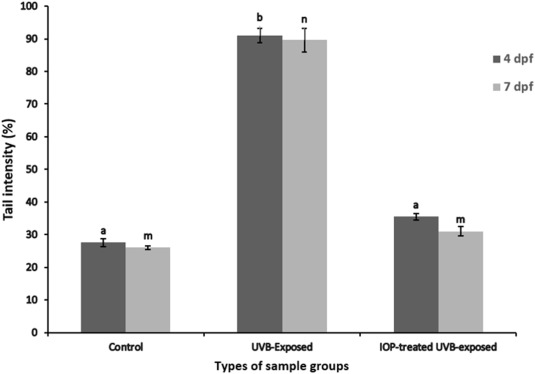
Figure Caption
Fig. 4 Comet assay histogram at 5 dpf and 7 pdf generated by analyzing the tail intensity (DNA fragmentation) using Image J in the three zebrafish (groups control, UVB-exposed, IOP treated UVB-exposed). Tail intensity was significantly increased in the UVB-exposed group compared to control and IOP-treated UVB exposed groups (ANOVA at 4dpf, F = 2021, p < 0.0001, ANOVA at 7 dpf F = 2256, p < 0.0001). Different letters represent statistically significant differences (P < 0.05).
Acknowledgments
This image is the copyrighted work of the attributed author or publisher, and
ZFIN has permission only to display this image to its users.
Additional permissions should be obtained from the applicable author or publisher of the image.
Full text @ Heliyon