
Fig. 3.
- ID
- ZDB-IMAGE-210320-27
- Publication
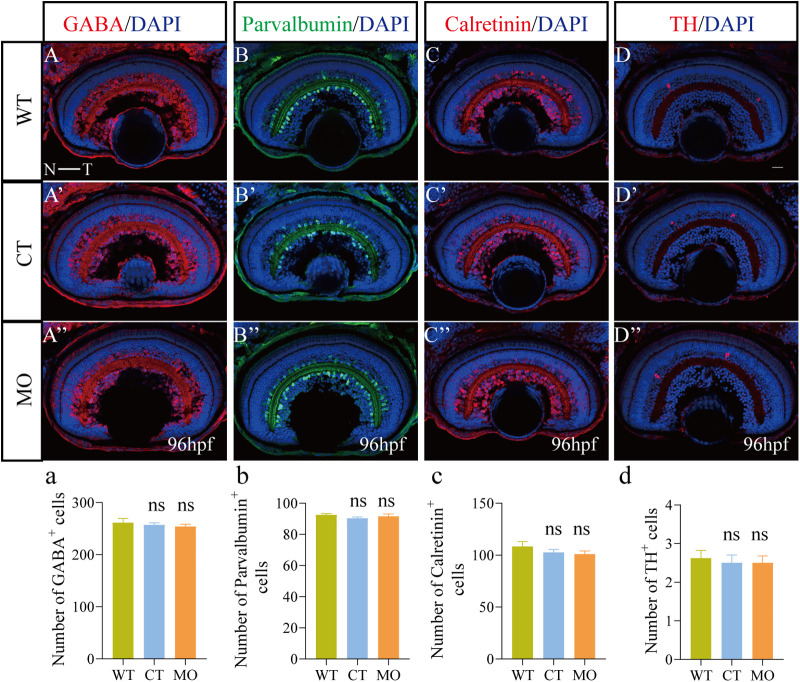
- Guo et al., 2021 - LIM Homeobox 9 Knockdown by Morpholino does not Affect Zebrafish Retinal Development
- All Figures
- Figures for Guo et al., 2021
|
Fig. 3.