
|
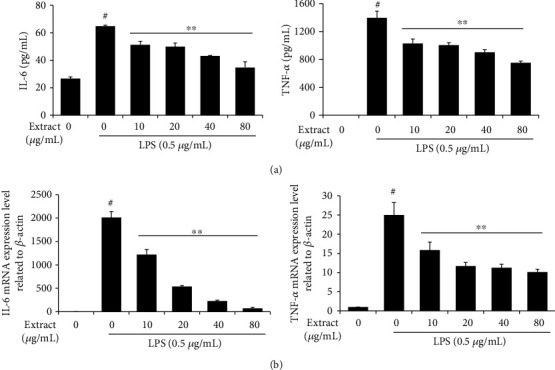
Figure 4 Effects of UA extract on the transcription and translation of interleukin- (IL-) 6 and TNF-α in LPS-induced RAW 264.7 cells. (a) Cells were treated with the indicated concentrations of UA extract for 1 h prior to incubation with LPS (0.5 μg/mL) for 24 h. The level of IL-6 and TNF-α in the supernatant was determined by enzyme-linked immunosorbent assay (ELISA). (b) Cells were treated with UA extract for 1 h and then induced with LPS for 6 h. β-Actin expression was used as an internal control for quantitative RT-PCR analysis. Three independent experiments were performed, and the data are presented as the mean ± SEM. *P<0.05 and **P<0.01 compared to the cells treated with LPS alone.