
Fig. 2
- ID
- ZDB-IMAGE-210301-157
- Genes
- Publication
- Ferrero et al., 2020 - A csf1rb mutation uncouples two waves of microglia development in zebrafish
- All Figures
- Figures for Ferrero et al., 2020
|
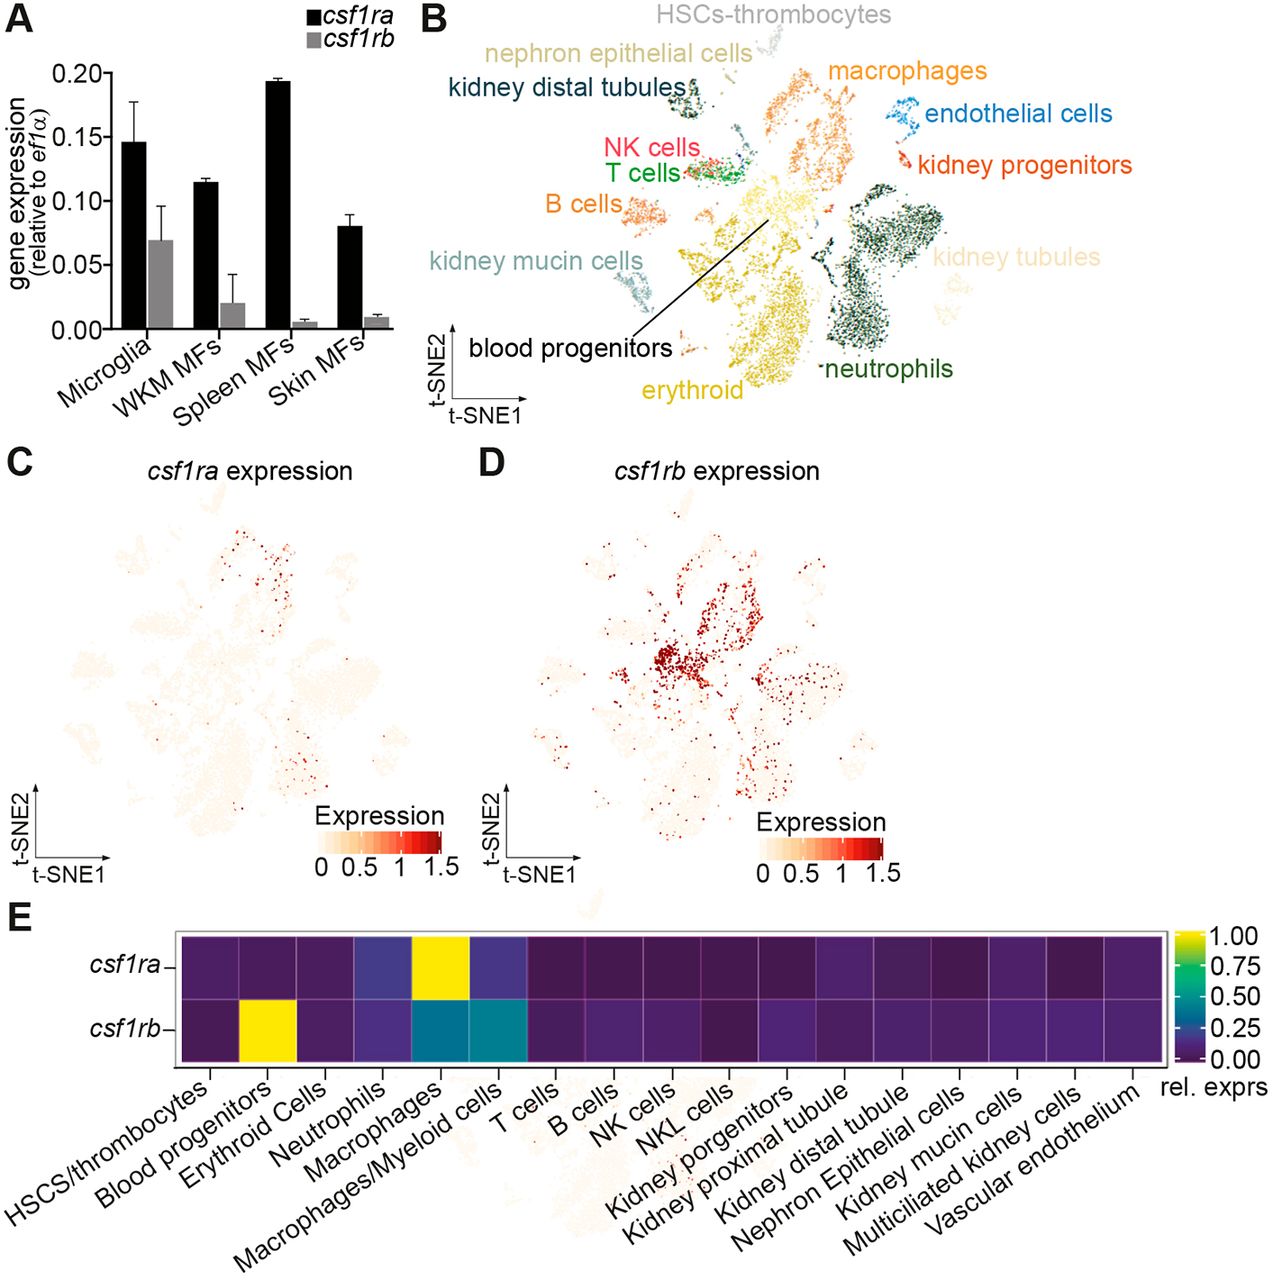
Fig. 2 Characterization of csf1r paralog expression in adult hematopoietic cells. (A) qPCR expression of csf1ra and csf1rb in cd45:DsRed+;mhc2dab:GFP+ mononuclear phagocytes sorted from adult zebrafish organs. Values on the y-axis indicate transcript expression normalized to ef1α expression level. Error bars represent s.e.m. for three experimental replicates. MF, mononuclear phagocytes. (B-E) Expression profiles of csf1r paralogs in adult WKM hematopoietic and non-hematopoietic populations by single-cell RNA-seq analysis, extracted from the public database from Lareau et al. (2017). 2D projection of the t-SNE analysis showing the distinct clusters identified in the adult WKM (B) and profiles of csf1ra (C) and csf1rb (D) expression across the clusters in the t-SNE plot. The intensity of the color is proportional to the level of gene expression. (E) Raw-scaled heatmap showing the relative expression of each csf1r paralog among the different cell clusters.