IMAGE

Fig. 1

ID
ZDB-IMAGE-210226-13
Source
Figures for Etzrodt et al., 2021
Image
Figure Caption

Fig. 1

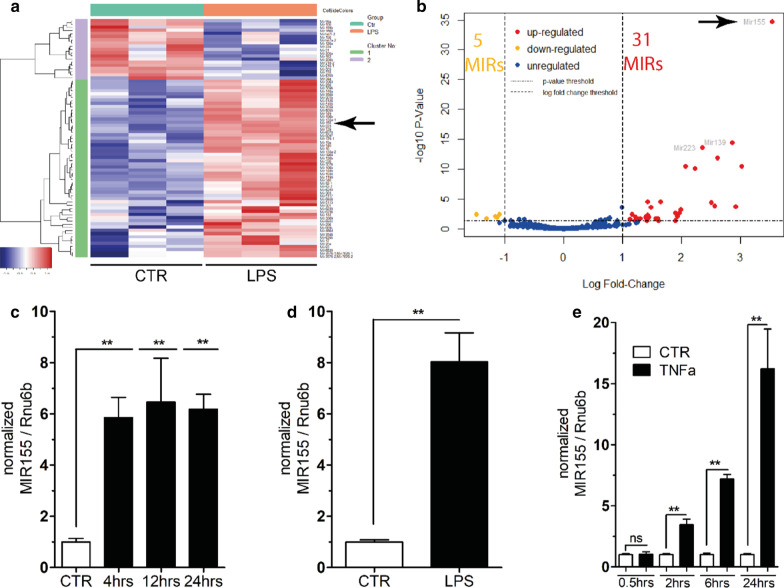
Unbiased MIR screening and confirmation in the endothelium of mice with a systemic inflammatory response. Mice were either given LPS (17.5 mg/kg BW i.p.) or vehicle (0.9% NaCl) and killed after 24 h or at indicated time-points. a A smallRNA sequencing was conducted using isolated CD146 + pulmonary endothelial cells (ECs) from endotoxemic compared to healthy mice. Shown is a heat map that highlights the gene distribution with the arrow pointing to the upregulation of MIR155. b Volcano plot showing a log scaled distribution of 318 analyzed endothelial MIRs. 5 MIRs were down- and 31 upregulated; MIR155 (arrow) showed the strongest upregulation (c). Bar graphs showing normalized MIR155 expression in lung lysates via RT-PCR after 4, 12 and 24 h compared to control (CTR) (CTR: n = 8; LPS: n = 4–5). d Bar graphs showing normalized MIR155/Rnu6b expression in CD146 + pulmonary ECs (n = 5). e In vitro confirmation of time-dependent MIR155 upregulation in human umbilical endothelial cells (HUVEC) (n = 4–6) after stimulation with the proinflammatory cytokine TNFa (50 ng/mL) compared to vehicle (CTR); Bar graphs show mean ± SD of normalized MIR155 with a maximum of 15 × fold increase at 24 h. (ce, all **p < 0.01)

Acknowledgments
This image is the copyrighted work of the attributed author or publisher, and ZFIN has permission only to display this image to its users. Additional permissions should be obtained from the applicable author or publisher of the image. Full text @ Crit Care