
Fig. 3
- ID
- ZDB-IMAGE-210217-56
- Publication
- Turan et al., 2020 - The endosomal trafficking regulator LITAF controls the cardiac Nav1.5 channel via the ubiquitin ligase NEDD4-2
- All Figures
- Figures for Turan et al., 2020
|
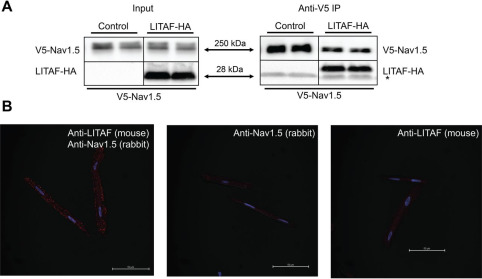
Fig. 3 Figure 3. Physical interaction between LITAF and Nav1.5 in HEK cells and 3wRbCM. A, V5 IP of lysates from HEK cells stably expressing V5-tagged Nav1.5 and transfected with plasmids for HA-tagged LITAF or empty expression plasmid (control) (n = 3). The right panel shows immunoprecipitated Nav1.5 and co-precipitated LITAF-HA and thus an interaction between LITAF and Nav1.5 (the asterisk indicates the light chain of the IP capture antibody). Input levels of Nav1.5 and LITAF-HA are shown in the left panel. B, Duolink in situ proximity ligation assay using mouse anti-LITAF and rabbit anti-Nav1.5 antibodies in 3wRbCM. The co-localization between molecules is indicated by red puncta (left panel). Virtually no puncta were detected in negative controls in which only one antibody was used, i.e. rabbit anti-Nav1.5 (middle panel) or mouse anti-LITAF antibodies (right panel). The nuclei were stained with DAPI (blue). Depicted merged confocal images (bright field, DAPI, and Texas Red) are representative of each condition. Scale bar, 50 μm.