
Fig. 4
- ID
- ZDB-IMAGE-210205-20
- Genes
- Publication
- Zhang et al., 2020 - Genetic evidence for Amh modulation of gonadotropin actions to control gonadal homeostasis and gametogenesis in zebrafish and its noncanonical signalling through Bmpr2a receptor
- All Figures
- Figures for Zhang et al., 2020
|
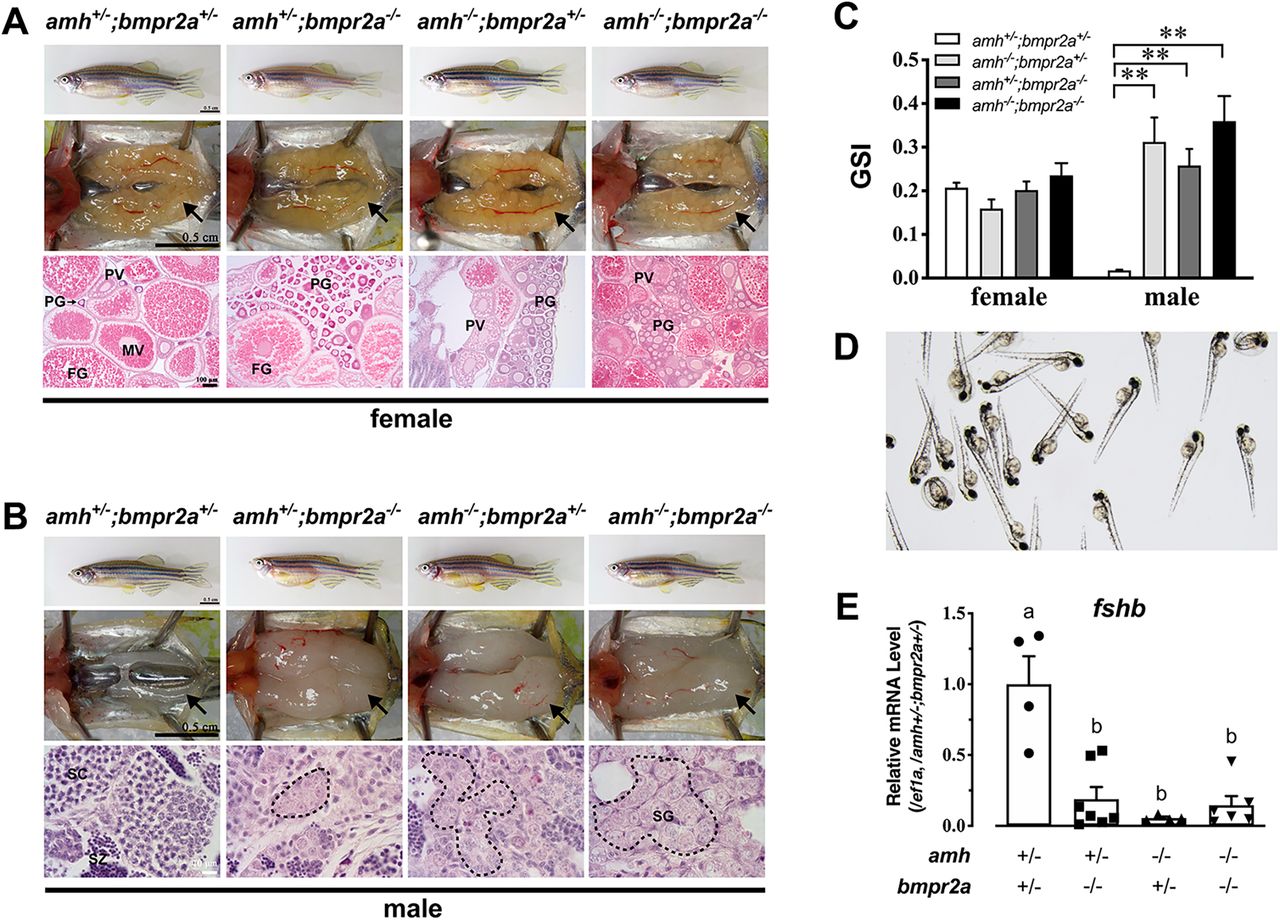
Fig. 4 Phenotype analysis of amh and bmpr2a double mutant at 3 mpf. (A) Ovaries of different genotypes. There was a significant accumulation of PG follicles in the amh single mutant (amh−/−;bmpr2a+/−), bmpr2a single mutant (amh−/−;bmpr2a−/−) and amh and bmpr2a double mutant (amh−/−;bmpr2a−/−) in comparison with the control (amh+/−;bmpr2a+/−). (B) Testes of different genotypes at 3 mpf. All three mutants (amh and bmpr2a single mutants and the double mutant) displayed tremendous testicular hypertrophy, with abundant spermatogonia (circled with dotted lines) and without any additive effect. (C) GSI of the different genotypes (n=5; **P<0.01; two-tailed Student's t-test for unpaired data). (D) Viable offspring (3 dpf) from male and female double mutants (amh−/−;bmpr2a−/−). (E) Expression of fshb in the pituitary of male amh and bmpr2a single and double mutants. The groups with different letters indicate that they are statistically significant (P<0.05) [n=4 (amh+/−;bmpr2a+/−), 7 (amh+/−;bmpr2a−/−), 4 (amh−/−;bmpr2a+/−) and 6 (amh−/−;bmpr2a−/−)]. Data are mean±s.e.m.