
Figure 6—figure supplement 1.
- ID
- ZDB-IMAGE-210204-95
- Publication
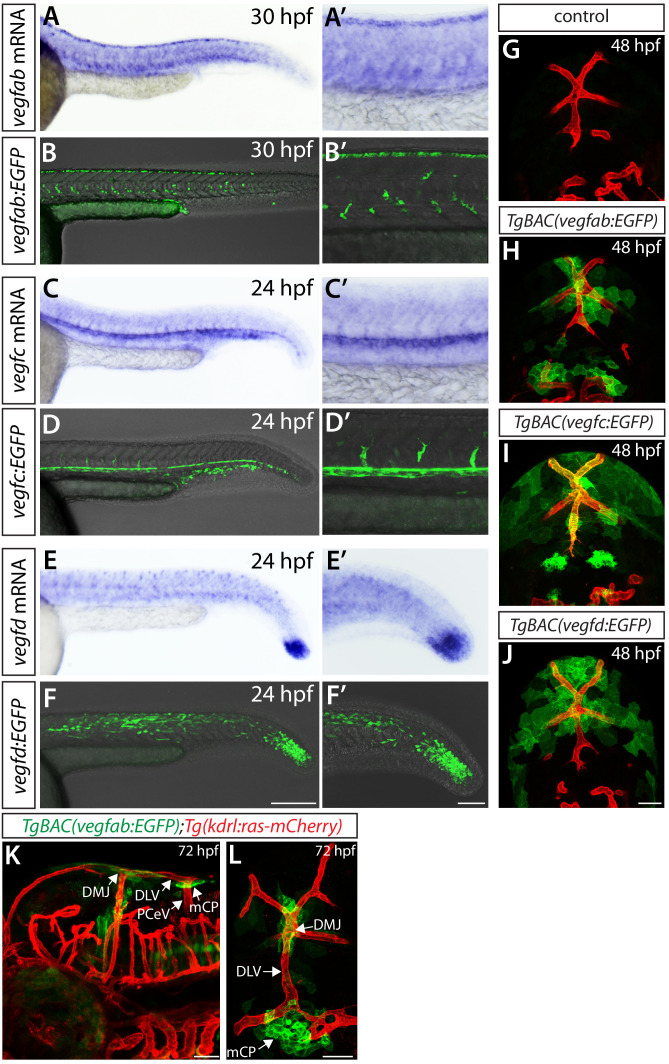
- Parab et al., 2021 - Endothelial cell type-specific molecular requirements for angiogenesis drive fenestrated vessel development in the brain
- All Figures
- Figures for Parab et al., 2021
|
Figure 6—figure supplement 1.
(