IMAGE

FIGURE 2

ID
ZDB-IMAGE-210204-72
Source
Figures for Wang et al., 2021
Image
Figure Caption

FIGURE 2

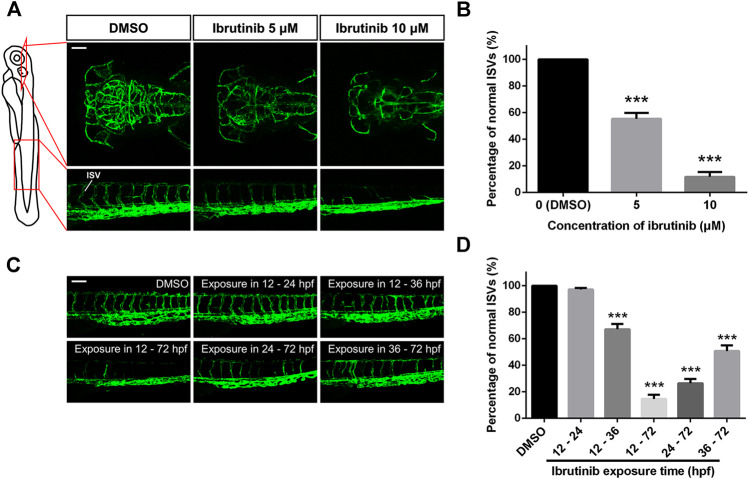
Vascular formation was perturbed in ibrutinib-treated embryos. (A) Confocal images of blood vessels in the brain and trunk of ibrutinib-treated Tg (kdrl:EGFP) embryos at 72 h post-fertilization (hpf). Scale bar: 100 μm. (B) The percentage of normal intersegmental vessels (ISVs) in embryos presented at (A); n = 10 for each group. (C) Confocal images of blood vessels in the trunk of embryos treated and washed at different stages. Scale bar: 100 μm. (D) The percentage of normal ISVs in embryos presented at (C); n = 10 for each group. Asterisks indicate significant differences (DMSO vs. ibrutinib), ***p < 0.001.

Acknowledgments
This image is the copyrighted work of the attributed author or publisher, and ZFIN has permission only to display this image to its users. Additional permissions should be obtained from the applicable author or publisher of the image. Full text @ Front Pharmacol