
Fig. 4
- ID
- ZDB-IMAGE-210131-8
- Genes
- Publication
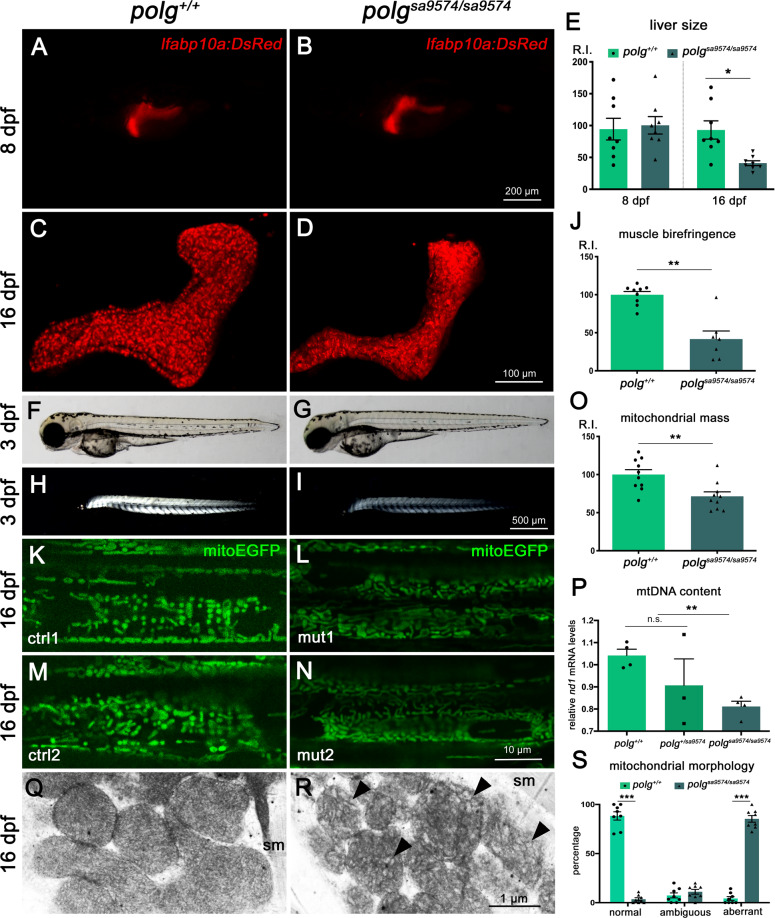
- Facchinello et al., 2021 - Efficient clofilium tosylate-mediated rescue of POLG-related disease phenotypes in zebrafish
- All Figures
- Figures for Facchinello et al., 2021
|
Fig. 4