
Image
|
Figure Caption
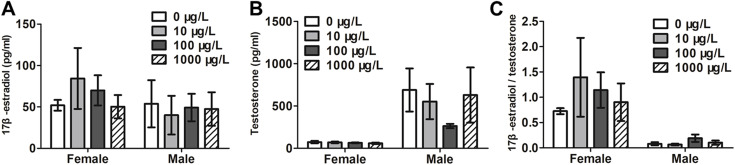
Fig. 4 Fig. 4. The 17 β-estradiol (A) and testosterone (B) concentrations and ratio (C) in adult zebrafish after exposure to different concentrations of polystyrene microplastics for 21 days. Error bars represent the mean ± standard error. n = 4 female/male fish.
Acknowledgments
This image is the copyrighted work of the attributed author or publisher, and
ZFIN has permission only to display this image to its users.
Additional permissions should be obtained from the applicable author or publisher of the image.
Full text @ Ecotoxicol. Environ. Saf.