
|
Figure 1
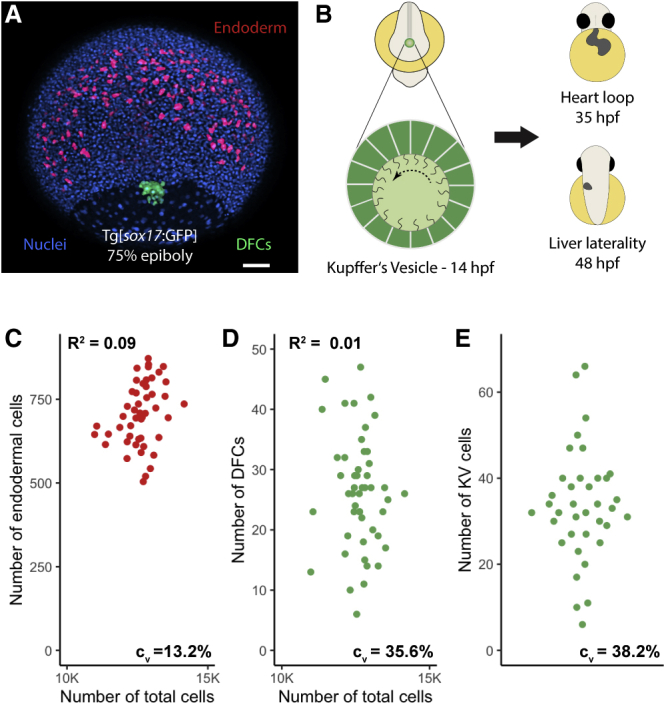
Cell Number Variability during Early Embryogenesis
(A) Maximum projection of confocal images of a Tg[
(B) Graphical representation of an 8-somite stage embryo, the KV, and the organ laterality at later stages.
(C–E) Cell number in endoderm (n = 49), DFCs (n = 49), and KV (n = 37), respectively, for individual embryos. The coefficient of variation (CV) is indicated at the bottom right; (C) and (D) also show the total cell number on the x axis (CV = 4.8%) and the coefficient of determination (R2). Total cell numbers are in good agreement with a previous publication (
See also