
Image
|
Figure Caption
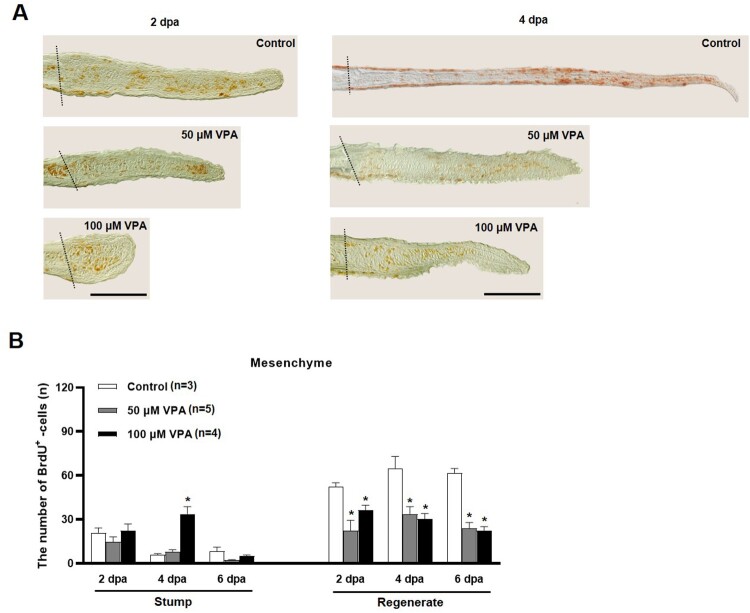
Figure 3.
Quantification of BrdU-labeled cells in the mesenchymal area of regenerated fin at 2, 4, and 6 dpa. (A) Images show BrdU-labeled cells in the sagittal sections at 2 and 4 dpa. A dotted line indicates the amputation site, and brown colored dots are BrdU-labeled cells. Scale bar = 500 µm. (B) Bars indicate the number of BrdU-labeled cells in mesenchymal area of the stump and regenerated fin at 2, 4, and 6 dpa. Data were expressed as the means ± S.E.M (n≥3) and tested via
Acknowledgments
This image is the copyrighted work of the attributed author or publisher, and
ZFIN has permission only to display this image to its users.
Additional permissions should be obtained from the applicable author or publisher of the image.
Full text @ Animal Cells Syst (Seoul)