
Image
|
Figure Caption
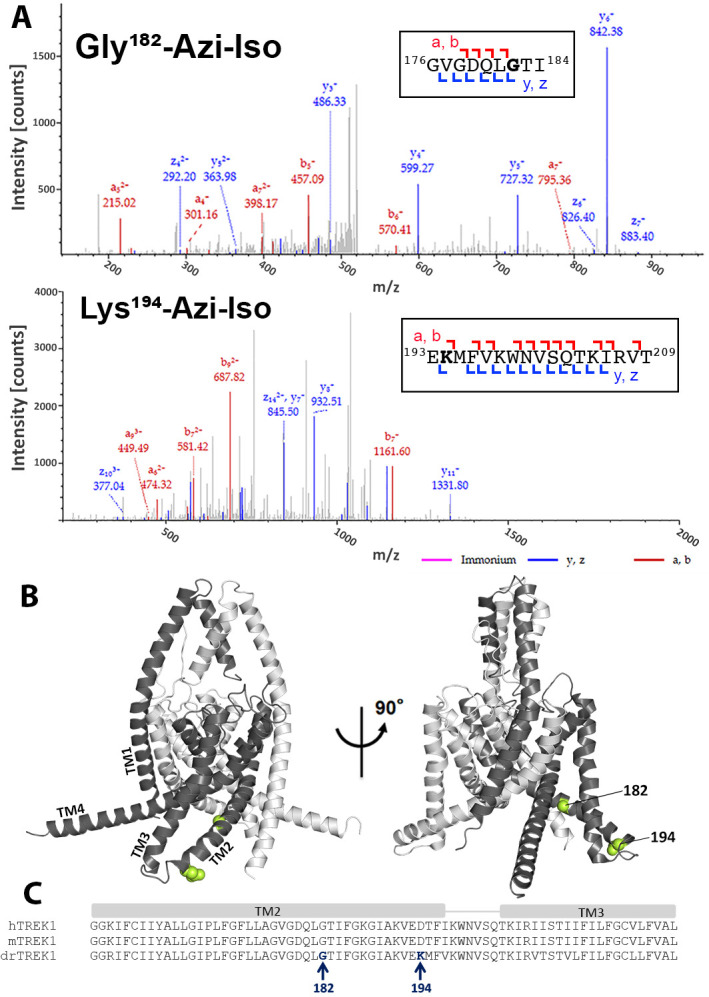
Figure 2 (A) Mass spectra of drTREK1 photoaffinity labeled peptides labeled at Glycine182 (top) and Lysine 194 (bottom). Colored intensities denote the identified peptide a, b, z, and y ion fragments for the sequence assignment, as shown in the inset boxes. See Figure 2—figure supplement 3 for corresponding peptide tables. (B) A structural model of mouse TREK1 (PDBID 6CQ6), showing the positions of residues G182 and K194 (labeled lime spheres) along the TM2 helix. (C) Alignment of the TREK1 TM2 and TM3 helixes from human (hTREK1), mouse (mTREK1), and zebrafish (drTREK1).
Acknowledgments
This image is the copyrighted work of the attributed author or publisher, and
ZFIN has permission only to display this image to its users.
Additional permissions should be obtained from the applicable author or publisher of the image.
Full text @ Elife