
Image
|
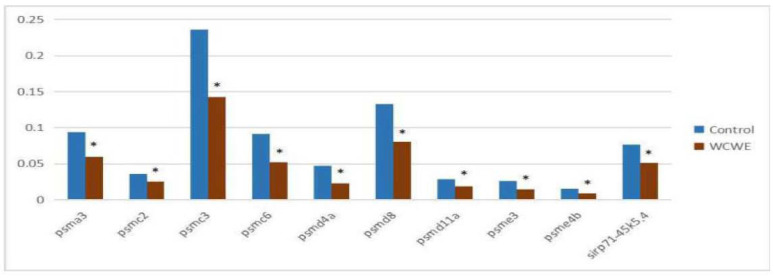
Figure Caption
Figure 5
Results of qRT-PCR assay. The relative genetic expression levels of the ten genes involving proteasome signaling pathway. There was significant differences between the vehicle control group and the WCWE group in all ten genes (* indicates P < 0.05).
Acknowledgments
This image is the copyrighted work of the attributed author or publisher, and
ZFIN has permission only to display this image to its users.
Additional permissions should be obtained from the applicable author or publisher of the image.
Full text @ J Cancer