
Figure 4—figure supplement 1.
- ID
- ZDB-IMAGE-201211-18
- Publication
- Kennard et al., 2020 - Osmolarity-independent electrical cues guide rapid response to injury in zebrafish epidermis
- All Figures
- Figures for Kennard et al., 2020
|
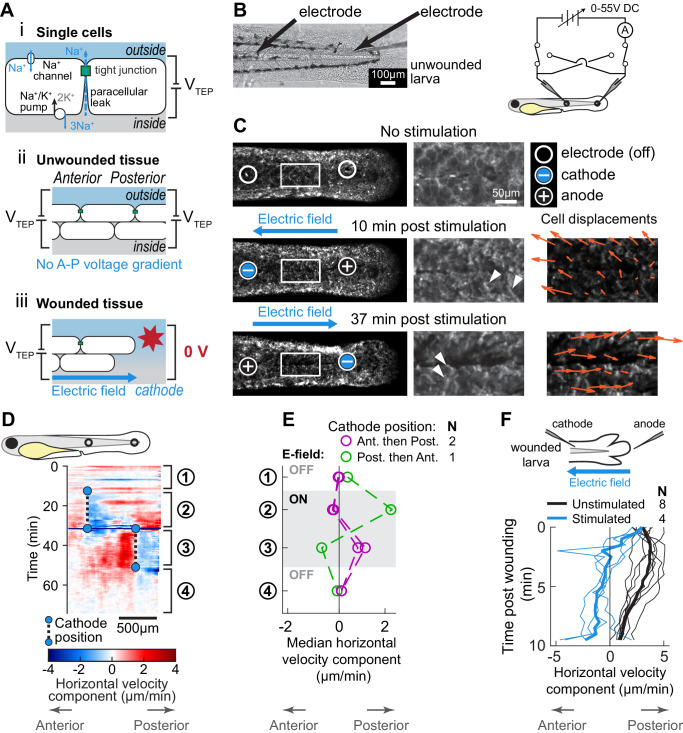
Figure 4—figure supplement 1. (A) (i) Schematic of the origin of the transepithelial potential (TEP) due to circulating flow of sodium ions. Other ions (such as chloride) may also be transported using energy derived from the sodium-potassium pump, and are not shown here for clarity. (ii) Unwounded tissue does not show an anterior-posterior TEP gradient. (iii) Wounding short-circuits TEP leading to an anterior-posterior TEP gradient and electric field. (B) (Left) Brightfield image of tailfin from 3 dpf larva expressing LifeAct-EGFP in basal cells (TgBAC(∆Np63:Gal4); Tg(UAS:LifeAct-EGFP)), with electrodes inserted under the skin. (Right) Electrical stimulation circuit with variable DC voltage, current measurement, and switches to reverse current polarity in the larva. (C) Z-projections of LifeAct signal from larva shown in (B). (Top) electric field off; (Middle) electric field on with cathode at anterior electrode; (Bottom) electric field reversed with cathode at posterior electrode. Stills are from one continuous timelapse. Insets are shown, and displacement vectors from tissue motion tracking are shown in orange. Arrowheads: examples of polarized LifeAct intensity oriented toward the cathode. (D) Velocity kymograph from a representative timelapse. Color indicates horizontal velocity component from tissue motion tracking analysis. Blue circles and dashed lines indicate the position of the cathode when the electric field was turned on, roughly corresponding to the empty circles on the larva diagram. Numbers 1–4 indicate different phases of the timelapse. 1: electric field off; 2: electric field on, cathode anterior; 3: electric field on, cathode posterior; 4: electric field off. (E) Median horizontal velocity component from three different larva. Tissue velocity was averaged in the region between the two electrodes and then the median velocity during each phase 1–4 (described above) was plotted. For one larva (shown in green) the cathode was initially positioned at the posterior electrode and was then switched to the anterior electrode. (F) Average horizontal velocity component from stimulated or unstimulated larvae. In the stimulated condition, 3 dpf larvae expressing LifeAct-EGFP in basal cells (TgBAC(∆Np63:Gal4); Tg(UAS:LifeAct-EGFP); Tg(hsp70:myl9-mApple)) were impaled with one electrode, with the other electrode positioned immediately posterior to the tailfin. Larvae were then wounded and the electric field turned on, with the cathode positioned at the anterior electrode. Tissue motion between the cathode and the wound was analyzed. Thin lines represent velocity for each larva. Thick lines represent average over larvae. Unstimulated data is the same as in Figure 2A.